2.3.5 – Defect Report Information
The information on a defect report should suffice for the following purposes:
- Management of the defect report through the defect lifecycle
- Assessment of overall project status, especially in terms of product quality, and test progress
- Assessment of the status of a product increment in terms of product quality
- Assessment of process capability
The information needed for defect management and project status can vary depending on when the defect is detected in the SDLC. In addition, defect reports related to non-functional quality characteristics may need more information (e.g., load conditions for performance issues). However, the core information gathered should be consistent across the SDLC and ideally across all projects in an organization to allow for meaningful comparison of defect data throughout the project and across all projects.
Many data items can be collected in a defect report. The test manager should decide which information is appropriate for effective defect management for a given project context. Due to the fact that each additional attribute increases the time spent on defect reporting and may increase confusion by the person who is entering the defect report, it is advisable to only collect data that is needed for defect management in the given context and/or will be used for process improvement.
To manage the defect report in most environments, the following are mandatory:
- A defect title with a short summary of the anomaly
- A detailed description of the anomaly preferably including steps to reproduce the failure
- Severity of the impact on the system under test and/or the product stakeholders
- Priority to fix the anomaly
Additional important data items are often created by the defect management tool:
- Unique identifier for the defect report
- Date/time of creation of the defect report
- Name of the person who discovered and/or reported the anomaly
- Project and SDLC phase in which the anomaly was discovered
- Current state of the defect report
- Current owner (i.e., the person currently assigned to work on the defect)
- Change history such as the sequence of actions, including date/time information, taken by project team members to isolate, repair and confirm the defect as fixed
- References (e.g. to test case, to connected defects).
Depending on context, further information (e.g. traceability) may also be collected in a defect report (see the ISO/IEC/IEEE 29119-3 for more information). The following bullet points group the information according to the intended purpose:
- To help defect resolution : The subsystem or component in which the defect lies, the specific test item and its release number in which the anomaly was observed or the test environment in which the defect was observed
- To assess the overall project status: Information to monitor progress, (e.g., risks, costs, opportunities, and benefits associated with fixing or not fixing the defect, a description of any available workaround, or requirements affected by the defects)
- To assess the status of a product increment in terms of product quality: The type of defect (usually corresponding to a defect taxonomy), the work product in which the defect was introduced, or the quality characteristic/sub-characteristic affected by the defect
- To assess the process capability : Information to monitor the effectiveness and efficiency of the development processes (e.g., the SDLC phase of introduction, detection, and removal for the defect or defect root cause)
5.5 – Defect Management
Since one of the major test objectives is to find defects, an established defect management process is essential. Although we refer to "defects" here, the reported anomalies may turn out to be real defects or something else (e.g., false–positive result, change request) - this is resolved during the process of dealing with the defect reports. Anomalies may be reported during any phase of the SDLC and the form depends on the SDLC. At a minimum, the defect management process includes a workflow for handling individual defects or anomalies from their discovery to their closure and rules for their classification. The workflow typically comprises activities to log the reported anomalies, analyze and classify them, decide on a suitable response such as to fix or keep it as it is and finally to close the defect report. The process must be followed by all involved stakeholders. It is advisable to handle defects from static testing (especially static analysis) in a similar way.
Typical defect reports have the following objectives:
- Provide those responsible for handling and resolving reported defects with sufficient information to resolve the issue
- Provide a means of tracking the quality of the work product
- Provide ideas for improvement of the development and test process
A defect report logged during dynamic testing typically includes:
- Unique identifier
- Title with a short summary of the anomaly being reported
- Date when the anomaly was observed, issuing organization, and author, including their role
- Identification of the test object and test environment
- Context of the defect (e.g., test case being run, test activity being performed, SDLC phase, and other relevant information such as the test technique, checklist or test data being used)
- Description of the failure to enable reproduction and resolution including the test steps that detected the anomaly, and any relevant test logs, database dumps, screenshots, or recordings
- Expected results and actual results
- Severity of the defect (degree of impact) on the interests of stakeholders or requirements
- Priority to fix
- Status of the defect (e.g., open, deferred, duplicate, waiting to be fixed, awaiting confirmation testing, re-opened, closed, rejected)
- References (e.g., to the test case)
Some of this data may be automatically included when using defect management tools (e.g., identifier, date, author and initial status). Document templates for a defect report and example defect reports can be found in the ISO/IEC/IEEE 29119-3 standard, which refers to defect reports as incident reports.
7.2.2 – Creating Proper Controls and Data Gathering Mechanisms for Reporting
The impact and effect of a security vulnerability is normally judged to have a higher sensitivity compared to “normal” defects. This leads to the need to be more precise and accurate about reporting the nature of the defect and the implied risks. In most projects security defects are categorized with a higher severity than comparable functional defects.
The latter implies that management has a higher focus on security defects, their risks and possible resolutions. Security defect reporting must carefully assess the impact of a discovered problem, the accuracy of test results, and should be available in a well-defined and timely manner. It is good practice to discuss with the management how and when they would like to have access to the security defect reports.
5.2.1 – Defect Analysis
Testers collect and report discrepancies between actual and expected outcome through defect reports. A defect report contains all relevant information the tester can provide to help the business analyst understand what happened and to assess the deviation.
Defect analysis is a joint activity of testers and business analysts. Usually, the tester identifies the acceptance criteria that are not satisfied. The business analyst may then be asked to analyze its impact on the related business processes. This includes determining the priority of the defect (e.g., low, medium, high, critical) with respect to its potential business impact on system usage.
To analyze the business impact of a defect, the business analyst and tester may do the following:
- Explore the path(s) in the business process models in which the defect(s) was found
- Explore the business rules which were not implemented correctly and analyze the priority of the defect from a usage point of view
The impact analysis and the resulting decision regarding further actions to be taken are documented in the defect report.
2.3.1 – Defect Lifecycle
Each phase of the SDLC should include activities to detect and remove potential defects. For example, static testing techniques (i.e. reviews and static analysis) can be used on design specifications, requirements specifications and code prior to delivering those work products into subsequent activities. The earlier each defect is detected and removed, the lower the overall cost of quality for the product. Cost of quality is minimized when each defect is removed within the same phase in which it was introduced (i.e., when the software process achieves perfect phase containment).
During static testing we search for defects. During dynamic testing the presence of a defect is revealed when it causes a failure, which results in a discrepancy between the actual results and the expected results of a test (i.e., an anomaly). In some cases, a false-negative result occurs when the tester does not observe the anomaly. When an anomaly is observed, further investigation should be performed. This investigation usually starts with completing a defect report in accordance with the defined test and defect management process. A failed test does not always result in the creation of a defect report. (For example, in test-driven development, where component tests, usually automated, are used as a form of executable design specification). Until the development of the component is complete, some or all of the tests must initially fail. Until the development of the component is complete, some or all of the tests must initially fail. Therefore, the result of such a test is not necessarily caused by a defect and is typically not tracked via a defect report.
A defect report progresses along a workflow (for simplicity and consistency with most defect management tools we will further use the term “defect workflow”) and moves through a sequence of defect states. In most of these states, one person owns the defect report and is responsible for carrying out a task (e.g., analysis, defect removal, or confirmation test). The following diagram represents a simple defect workflow:
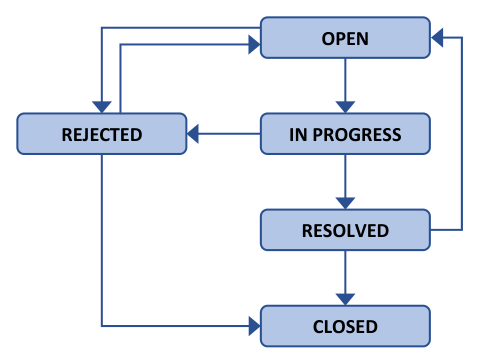
Figure 2: A Simple Defect Workflow
A simple defect workflow may cover the following defect states:
- OPEN (may be called NEW): The initial state when the defect report is created.
- IN PROGRESS: The team is working on the defect report analysis and/or fix.
- REJECTED: A defect report is rejected by the person who processed it (usually a developer or an analyst). There may be many reasons for rejection (e.g., invalid information, incorrect test, duplicate defect report) and this information is added to the defect report.
- RESOLVED (may be called FIXED, READY FOR RETEST): A tester runs a confirmation test often following the steps to reproduce the failure from the defect report itself to determine whether the fix has indeed resolved the defect.
- CLOSED: The defect report has reached its terminal state, and no further work is intended to be done. The tester transitions the defect report to this state either after a successful confirmation test or to acknowledge rejection of the defect report.
A simple defect workflow is used in many organizations and is extended by the use of other defect states relevant for a given context (e.g., RE-OPENED, ACCEPTED, CLARIFICATION, or DEFERRED).
The defect workflow may vary in different organizations in terms of different names of the defect states, rules for transitions among defect states and roles responsible for tasks in given defect states. Often the defect workflow is more simple in Agile software development than in sequential development models. The defect workflow should be adapted to a given context. When designing the defect workflow, it is advisable to respect several good practices:
- If possible, the defect workflow should be defined organization-wide to provide unified defect management across all projects
- Duplicate and false-positive defects should be represented by a separate state or a combination of the REJECTED status with choosing the reason for rejection. They may be helpful in further defect analyses with the aim of improving the test process.
- It is recommended to use only one terminal state (e.g., CLOSED). The transition to this state often requires choosing a reason for closure, useful for process assessment and process improvement activities.
- The names of states in the defect workflow should be the same as for analogous states used for other entities (e.g., user stories and test tasks) to simplify working with them.
- Consecutive defect states should belong to different responsible roles. If two or more consecutive states belong to the same responsible role, there should be a good reason (e.g., to measure the time spent in a defect state).
- Each defect state, except for the terminal state, should have more than one outgoing transition to allow the responsible role a decision regarding the next step. Exceptions of this rule should be justified (e.g., to monitor time spent on a given activity).
- The set of attributes required to be entered when performing a state transition should be limited to those which give substantial value to defect management.
2.3.6 – Defining Process Improvement Actions Using Defect Report Information
As discussed in Section 2.3.5 of this syllabus, Defect Report Information, defect reports can be useful for project status monitoring and reporting. While the implications of metrics on the test process are primarily addressed in the Expert Test Management Syllabus, at the Advanced Test Management Level, test managers should be aware of what defect reports mean to assessing the capability of the software development and testing processes.
In addition to the test progress monitoring information mentioned in this syllabus, in section 2.1.2, Monitoring, Control and Completion, and in section 2.1.3, Test Reporting, defect information should support process improvement initiatives as discussed during retrospectives. Examples include:
- Using information about the phases of introduction, detection, and removal of defects to assess phase containment and/or perform cost of quality analysis with the aim of suggesting ways to improve defect detection effectiveness in each phase and minimize the cost associated with defects
- Using information about the phase of introduction for analysis of the phases in which the largest number of defects are introduced, to enable targeted improvements for defect prevention
- Using defect root cause information to determine the underlying reasons for defect introduction, to enable process improvements that reduce the total number of defects
- Using defect location information to perform defect cluster analysis, to better understand technical risks (for risk-based testing) and to enable re-factoring of troublesome components
- Using information about re-opened defects to assess the quality of debugging implementations
- Using information about duplicate and rejected defects to assess the quality of the defect report creation
- Enable process improvements that reduce the total number of defects by introducing pro-active measures to avoid errors upfront
The use of metrics to assess the test process effectiveness and efficiency is discussed in the Expert Test Management Syllabus.
In some cases, teams decide not to track defects found during some or all phases of the SDLC. While this is often carried out in the name of efficiency and for the sake of reducing process overhead, it greatly reduces visibility into the process capabilities of software development and testing. This makes the improvements suggested above difficult to carry out due to a lack of reliable support data.
2.3.2 – Cross-functional Defect Management
Although the test organization and the test manager often own the overall defect management process and the defect management tool, a cross-functional team is generally responsible for managing the defects for a given project. This team, sometimes called the defect management committee, may include the test manager, representatives of development, suppliers, project management, product management or product owner and other stakeholders who have an interest in the software under test.
As anomalies are discovered and entered into the defect management tool, the defect management committee should determine whether each defect report represents a valid defect and whether it should be fixed (and by which party in case several development teams are participating in delivery), rejected, or deferred. This decision requires the defect management committee to consider the benefits, risks and costs associated with fixing the defect. It is beneficial to discuss the consideration in a meeting (often called the triage meeting). If the defect is to be fixed, the team should establish the priority of fixing the defect relative to other tasks. The test manager and test team may be consulted regarding the relative importance of a defect and should provide the available objective information.
On very large projects the appointment of a full-time defect manager may be justified by the effort needed to prepare for and to follow-up on the decisions made by defect management committee meetings, at least during those SDLC phases when testing is at its most intensive. In other situations, several large projects may share a defect manager.
A defect management tool should not be used as a substitute for good communication, nor should a defect management committee be used as a substitute for effective use of a good defect management tool. Communication, adequate tool support, a well-defined defect workflow (incl. defect report properties) and an engaged defect management team are all necessary for effective and efficient defect management.
2.3.3 – Specifics of Defect Management in Agile Teams
Defect management in organizations using Agile software development is often lightweight and/or less formal than in sequential development models. If Agile teams are co-located or have well established communication means available, information about a defect or failure is often exchanged among testers, customer representatives and developers without a formal defect report. Defect reports should, however, be created for:
- Defects that block other current sprint activities (i.e., development, testing, or other) and could not be fixed immediately within the Agile team
- Defects that cannot be resolved within the same iteration. Some Agile teams have a rule of creating a defect report if the defect cannot be resolved during the day the failure is found.
- Defects which must be resolved by or in cooperation with other teams in multi-team organizations
- Defects that must be solved by a supplier
- Defects where a defect report is explicitly requested (e.g., when a developer cannot immediately work on a fix)
Common practice is to add defects that cannot be resolved within the same iteration to the product backlog so that they can be prioritized among other defects and user stories for a later iteration.
Although the foundations of defect management should be set in an organization's test strategy, many aspects including the level of formality, triggers for creation of a defect report, and defect attributes to be captured may be left to agreement among Agile team members. In general, the level of formality of defect management and the approach to creating defect reports should reflect the following:
- Co-location of team members
- Distribution of team members across time zones
- The number of teams that cooperate on product development
- Maturity of the team(s)
- Size of the team(s)
- Risks associated with the product
- Regulatory, contractual, or other requirements (if and where applicable)
The final decision of the Agile team regarding the details of defect management should always be documented (e.g., with guidelines in a knowledge management tool).
2.1.3 – Test Reporting
Test management should understand how to interpret and use metrics to understand and report test status. For higher levels of testing such as system testing, system integration testing, acceptance testing, and security testing, the primary test basis is typically work products such as requirement specifications, use cases, user stories and product risks. Metrics of structural coverage are more applicable to lower levels of testing such as component testing (e.g. statement coverage) and component integration testing (e.g., interface coverage). While test management may use metrics of code coverage to measure the extent to which their tests exercise the structure of the system under test, reporting of higher-level test results should be tailored to the specific context and needs of the project. For example, in frequently changing environments, code coverage metrics may be useful to monitor the impact of code changes on the test suite and identify potential gaps or risks. In addition, test management should understand that even if component tests and component integration tests achieve 100% of their structural coverage, defects and quality risks remain to be addressed at higher test levels.
The objective of reporting metrics is to provide an immediate understanding of the information for management purposes. Metrics can be reported as a snapshot of a metric at a point in time or as the evolution of a metric over time to evaluate trends.
Product risks, defects, test progress, coverage and related cost and test effort are measured and reported in specific ways at the end of the project.
The following are examples of metrics that can be used for different purposes:
Metrics related to product risks include:
- Percentage of risks of which all tests passed
- Percentage of risks of which some or all tests failed
- Percentage of risks not yet completely tested
These metrics can be used to assess the quality of the test basis and the effectiveness of the test cases in covering the product risks.
Metrics related to defects include:
- Accumulated number of resolved defects versus the accumulated number of defects
- Breakdown of the number or percentage of defects categorized by:
- Test items or components
- Source of the defect (e.g., requirement specification, new feature, or regression)
- Test releases
- Test level or iteration introduced, detected, and removed
- Priority/severity
- Root cause
- Status (e.g., rejected, duplicated, open, closed)
These metrics can be used to monitor the defect detection and resolution process, identify the areas of high defect density or defect severity, and evaluate the test efficiency and effectiveness.
Metrics related to test progress include:
- Test execution status: Total number of tests planned, implemented, executed, passed, failed, blocked, and skipped
- Test effort: Number of actual versus planned resource hours devoted to testing
Metrics related to coverage include:
- Requirements coverage: The percentage of requirements that are covered by test cases
- Product risk coverage: The percentage of identified product risks that are mitigated by test cases
- Code coverage: The percentage of code statements, branches, paths, or conditions that are executed by test cases
Metrics related to costs and test effort include:
- Residual risks for untested components: The potential impact and likelihood of defects in the components that are not tested
- Test cost: The actual versus planned cost of testing
Additionally, it is useful to combine metrics from different categories (e.g., a metric that shows the correlation between the trends of open defects versus the trends of executed tests, or a metric that shows the quality of the test basis based on the number of defects found in the requirements). When test execution continues and fewer and fewer defects are identified, a decision can be made to terminate the tests. This decision should be based on the reporting of the metrics and the agreed exit criteria.
5.2.2 – Reporting
Reporting activities during acceptance testing address a specific target audience (for example business managers, product managers or domain experts). These stakeholders are experts in the application domain, but they are not always familiar with implementation details. Therefore, information on acceptance test progress, results, and detected defects should be presented without technical details in the language of the target audience.
Using metrics is an important part of reporting test progress. The overall test result is provided in a test summary report. Apart from summarized information on test execution and results of all test phases, the test summary report provides additional information from the impact analysis of open defects. The test summary report also provides an indication of whether the targeted quality criteria have been reached.
Based on the test summary report, decision makers should be able to determine whether the system under test has reached the necessary pre-defined level of quality and may be released to production or not. Several outcomes are possible, including the following:
- The system may be released “as is” and rolled out without restrictions.
- The system may be released with reservations. Known errors which have a workaround are communicated to the user and the support team. For defects that represent an important risk, the related feature (or sub-system) may be excluded from roll-out.
- The system is rejected until critical defects have been fixed and re-tested. Roll-out is either postponed or replaced by alternative solutions.
7.3 – Evaluating and Using Information - Internal Reporting
The information gathered must be processed to be useful. This includes conducting a careful evaluation of the information both to validate the data and to compare the actual to the expected values. If the information does not match the project expectations, investigation will be required to understand the variance and perhaps take corrective actions. For example, if the expected defect discovery rate was 100 defects per week but the actual rate is 50 defects per week, this could mean that the software quality is considerably better than expected, or that the testers are out sick, or that the test environment is down so people have not been able to test.
Evaluating the information requires expertise. Not only must the evaluators understand the information that has been gathered, they must be able to effectively extract it, interpret it and research any variances. Reporting raw data is dangerous and may result in loss of credibility if the data later is discovered to be flawed.
Once the data has been evaluated and verified for accuracy, it can be used for internal reporting and action plans. Internal reports are circulated within the project team. For example, management metrics might be kept internal to the testing team while corrective actions are put in place to increase tester efficiency. Detailed defect metrics are usually shared with the development team, but may not be circulated to the project managers or external team members until they have been summarized.
Internal reporting is used by the Test Manager to manage and control the testing project. Some samples of internal reports that Test Managers may find useful include:
- Daily test design/execution status
- Daily defect status
- Weekly defect trending
- Daily test environment reports and status
- Resource availability
While internal reports may be less formal than external reports, the quality of the data is just as critical, particularly when management decisions will be based on the information in these reports. The time spent to develop good reporting tools and methods will result in time savings throughout the project.
6.1.4.3 – Report
The reporting of security vulnerabilities is described in Chapter 7.
2.3 – Defect Management Introduction
The ISTQB® Foundation Level Syllabus V.4 describes the activities which begin after observing actual results that differ from expected results. The syllabus refers to these activities as defect management. Other standards use the term “incident management” ISO/IEC/IEEE 29119-3 Standard or “anomaly management” (TMAP) to emphasize the fact that at the beginning of the process we may not know if the discrepancy is caused by a defect in a work product, or due to something else (e.g., test automation failure or a misunderstanding of the requirements by the tester). Defect management and the tool used to manage defects are of critical importance to the testers and to other team members involved in software development. Information from an effective defect management process allows the test team and other project stakeholders to gain insight into the state of a project throughout its SDLC. Defect management is also crucial for deciding which defects will be fixed. This ensures that effort is spent on working with the correct defects. Collecting and analyzing defect-related data over time can help to locate areas of potential improvement both for testing and for other processes within the SDLC (e.g., better defect prevention by improved architecture and technical design).
In addition to understanding the overall defect lifecycle and how it is used to monitor and control both the software development and testing processes, the test manager, and the testers (or whole Agile team in Agile software development) must also be familiar with which data is critical to capture. The test manager must be an advocate of the proper use of both defect management process and the selected defect management tool.
5.3.1 – Analyzing Test Results to Improve Defect Detection
Test results allow the TA to identify failures, but they also provide feedback to the TA to help improve defect detection effectiveness. Some commonly used techniques to analyze test results are described below.
Predicted versus actual defect cluster analysis . A few components usually contain most defects (see ISTQB-CTFL, v4.0.1, Section 1.3). After testing, the TA can identify the actual defect-prone areas and compare predicted versus actual defect clusters. In the case of discrepancies, more rigorous testing may be applied to areas where more defects were found than expected. When determining the clusters, measurable criteria should ensure clarity and consistency (e.g., defect density and defect severity). Among these criteria, the severity of the defects should play a significant role. Small clusters of critical or major defects are usually more important (i.e., need more rigorous testing) than larger clusters of minor or cosmetic defects.
Defect detection percentage (DDP) analysis . DDP is one of the most important test effectiveness measures for a test level. When calculating DDP, the number of escaped defects should be limited to those that the test level under consideration could have detected. Clear boundaries for defect counting, such as temporal limits (e.g., defects found within a defined time frame after release) and exclusion criteria (e.g., defects in third-party components or specific customer environments), should be established to ensure consistency. A low DDP for a given test level indicates a high percentage of escaped defects, meaning defect detection is ineffective. In such a case, the TA should analyze the reasons and propose measures to improve it, making the test level more focused and rigorous. The DDP is best divided by severity levels, as the priority of reducing escaped defects usually depends on their severity.
Structural coverage analysis assesses the extent to which tests have exercised specific areas of the test object. Identifying low-coverage areas allows the TA to target test efforts in those areas. Increasing their coverage helps to discover new, previously escaped defects. Structural coverage such as statement coverage, branch coverage, or neuron coverage is usually measured with test tools. When selecting the additional areas to be covered, their risk levels should be considered.
Test gap analysis assesses the extent to which tests have exercised recent code changes. This allows the TA to focus additional test effort in areas that are especially error prone (i.e., new changes that have not been tested at all) instead of targeting all areas that have low coverage (e.g., code that has not changed in a long time and has been tested for previous releases).
Defect arrival pattern analysis . The number or density of defects found in successive phases of a project (e.g., iterations) can be compared with patterns that describe the theoretical distribution of these values over time. A classic example of a defect arrival pattern is the Rayleigh model (Elsayed, 2021). It has a single peak and is skewed to the right, showing that the expected number of defects found first increases in time and, after reaching its maximum value, drops down slowly towards zero. Based on the analysis of such a pattern, it is possible to infer the strength of existing test cases and the potential for their improvement. For example, suppose defect detection remains at a constant, low level when the pattern suggests it should be increasing. In that case, it may mean that the existing tests are too weak and unable to detect additional defects.
The analytical methods described above use various defect-related metrics, such as the number of defects or DDP. These metrics are calculated based on the test results (e.g., number of tests passed/failed), defect reports, and structural metrics (e.g., code coverage or defect density). Note, however, that these metrics are not always as easy to read from the test results as they may seem. For example, the number of failed tests is not necessarily the same as the number of defects detected by these tests. To calculate the actual number of defects detected, the results of the debugging process must be carefully analyzed because the relation between test results and defects can be many-to-many. Several tests may detect the same defect or one test may detect several defects. Moreover, the severity of the defects may differ from the criticality of the tests, as a critical test case may fail due to a cosmetic defect.
5.8.3 – Report Results
A large amount of the Test Manager’s communication with the external test stakeholders is in the form of written reports, charts, metrics and presentations. All reports must be reviewed to ensure the data is accurate, presented correctly and clearly, and does not target any individual. For example, a report of defects found should never be reported by developer but rather should be reported by area of the software, feature, quality characteristic or using some other impersonal partition.
In addition to reporting the results of testing, internal communication such as defect reports, emails, status reports and other written and verbal communication should always be objective, fair and contain the proper background information so that the context is understood. The Test Manager must ensure that every member of the test team conforms to these requirements in all communications. Test teams have lost credibility when just one unprofessionally written defect report found its way into the hands of upper management.
7.4 – Sharing Information - External Reporting
The purpose of external reporting is to accurately portray the testing status of the project in terms that are understandable to the audience. It’s not unusual for the testing status to be at variance with the status that may be presented by other aspects of the project. This doesn’t mean that other reports are necessarily incorrect but rather that they are reporting from a different perspective. If the Test Manager realizes this is a problem area, it is a good practice to work with the other reporting managers to unify the data rather than risk confusing the audience.
One of the biggest challenges in external reporting is to tailor the information presentation to the audience. For example, while a detailed defect report might be effective for the development team, an executive will find a dashboard that presents the high level snapshot more informative. Generally, the higher the consumer is in an organization, general trending information may be more appropriate than a detailed report. Charting and visually attractive graphs become more important as the technical expertise of the consumer drops. Because executives may have little time to devote to reviewing reports, quick visuals, easily interpreted charts and trending diagrams are particularly useful in getting the point across quickly and accurately.
Another consideration when preparing external reports is the amount of information to supply. For example, if the reports are to be presented in a meeting, the presenter will be there to supply additional detail information if needed. If, on the other hand, the reports are published as a dashboard on the intranet, it may be useful to supply a drill down capability that will show the details if the reader is interested. If only the high level information is supplied and there is no detailed information to support it, credibility may be lost.
External reporting varies with the criticality of the project, the product domain and the expertise of the audience. Some examples of commonly used external reports include:
- Dashboard showing the current testing and defect status
- Resource and budget reports
- Risk mitigation chart
- Test coverage chart (requirements or risk-based)
- Defect trends
- Milestone achievement
- Project health indicators (red, yellow, green)
- Predictive metrics
- "Go/No go" recommendations
External reporting should be done on a regular basis, usually weekly. This trains the audience to expect to receive the information and to use that information in their own planning and decision making. There are various ways of effectively publishing this information. Some of these include:
- Real time dashboard
- Published to a known site on the intranet
- Emailed out to a distribution list
- Included in regular project status meetings
- Physically posted in an office window
External reporting is only effective when it is received and understood by the target audience. The reports must be specifically targeted for the audience and must contain the proper level of detail. Overwhelming the audience with details that they don’t understand or don’t care about may result in their disregarding the report in its entirety.
Success as a Test Manager is tightly related to the ability to accurately communicate testing status to those outside the testing organization. The Test Manager must consider the audience and the message and tailor the information appropriately.
5.3.2 – Supporting Root Cause Analysis with Defect Classification
Root cause analysis (RCA) is a technique for identifying and addressing the underlying or fundamental causes of a defect rather than only its symptoms. RCA supports a structured approach to quality improvement, and its primary objective is to prevent the recurrence of defects. The TA uses various techniques to identify root causes of defects and failures (e.g., defect taxonomies, the five whys technique, cause-effect diagrams, and Pareto analysis).
The classical RCA involves subject matter experts studying a defect in considerable detail after resolving it. However, there are usually many defects that need to be analyzed. Therefore, it would be very inefficient and time-consuming to have preventive action planning for each defect. One way to approach this problem is to classify defects and then perform the RCA for the defect types occurring.
Defect classification is based on the recognition that individual defects capture a great deal of information about the development process and the system under test. Defect classification allows the TA to extract information about various aspects of the development process from the defect and turn it into a process measurement. This, in turn, gives an insight into the types of errors made during development, which is helpful for process improvement. Defect classification bridges the gap between quantitative defect statistics and qualitative RCA. To effectively support RCA, the defects should be uniformly classified throughout the entire SDLC, from early testing to production.
The TA should support their organization in standardizing software defect classification. This will improve communication and the exchange of information regarding defects among developers and organizations, facilitating the RCA.
Examples of defect classification methods are:
- orthogonal defect classification (ODC) (Chillarege, 1992), which classifies each defect into orthogonal (i.e., mutually exclusive) attributes, collected both when a defect is reported and when it is fixed
- IEEE 1044 ( IEEE 1044 , 2009), a standard classification for software anomalies providing a core set of attributes for the classification of failures and defects
- severity-based classification, which classifies defects based on their severity (e.g., critical, major, minor, trivial)
- defect taxonomy models, such as (Beizer, 1990) or (Catolino et al., 2019)
Defects can also be mapped to quality attributes using software quality models such as ( ISO/IEC 25010 , 2023) or the FURPS model (Grady et al., 1987).
More information on RCA can be found in (ISTQB-ITP, v1.0).
7.5.5 – Test Closure Activities
When test execution is complete, the Test Manager must still conduct the test closure activities. These consist of ensuring that all the test work is actually completed, delivering the final work products, participating in retrospective meetings, and archiving the data, test cases, system configurations, etc. for the project.
- Metrics completed as part of the test closure activities
- Percentage of test cases that can be re-used on future projects
- Percentage of test cases that should be moved to the regression test suite
- Percentage of the defects that have reached the end of their lifecycle (will not be fixed, no action required, enhancement request, etc.)
- Interpretation of the metrics
- As with the previous stage, these metrics should have been tracked throughout the testing process but this is a good time to review them. Test cases that can be re-used are generally considered to be a better investment of time than those that were used once and are no longer usable. In rapidly changing environments, such as those following an agile lifecycle, test cases developed in the early iterations are often obsolete by the time the later iterations occur. Time invested in these ―throw away‖ test cases should be reviewed to see if it was well-spent or if another test design methodology would have been more efficient (for example, using checklists rather than scripted test cases).
- Test cases that are moved to the regression test suite because the features they test are expected to remain constant are good candidates for review by the automation team for potential automation.
- Defects that will not be resolved should be reviewed (as always) to determine if the test team is following good practices in identifying and documenting these items. If defects are marked "never fix" because they are not reproducible, the Test Manager should investigate to see if additional testing was required or better documentation was needed in these defect reports.
Test closure activities may identify areas for additional process improvements and may also identify areas that need to be tracked more closely on future projects.
7.5.2 – Analysis and Design
Through the test planning phase, a set of test objectives is defined. During the test analysis and test design phases, the test team takes these objectives and identifies the test conditions and creates the test cases that exercise the identified test conditions.
- Metrics for analysis and design Coverage metrics
- Defects found during test design
- Defects found during review cycles
- Interpreting the data
- Coverage metrics include coverage of the requirements by the test cases, coverage of the risk items by the test cases, coverage of the quality characteristics and any other measurable coverage type. If coverage is insufficient in any area, an unaddressed risk exists. That risk must be analyzed to determine the best method to deal with it based on the impact and likelihood.
- Defects found during the review cycles and during test design, if resolved, prevent those defects from escaping to the next phase. If the defect is identified but not resolved, there is still additional work incurred by the existence of that defect (documentation, status reporting, possible workarounds, etc.) but the time spent dealing with a known defect is usually less than that spent detecting a previously unfound defect. Cost (in money or time) is often associated with these defects and that cost is reported, usually in terms of cost savings, as part of the general test reporting.
- Defect trending is important at this phase also. If high numbers (higher than planned) of defects are found in the review cycles, this may indicate a lower quality of the work products than was anticipated. If so, multiple review cycles may be required to reach an acceptable quality before these work products move to the next phase in the lifecycle.
1.2.3 – Errors, Defects, Failures, and Root Causes
Human beings make errors (mistakes), which produce defects (faults, bugs), which in turn may result in failures. Humans make errors for various reasons, such as time pressure, complexity of work products, processes, infrastructure or interactions, or simply because they are tired or lack adequate training.
Defects can be found in documentation, such as a requirements specification or a test script, in source code, or in a supporting work product such as a build file. Defects in work products produced earlier in the SDLC, if undetected, often lead to defective work products later in the lifecycle. If a defect in code is executed, the system may fail to do what it should do, or do something it shouldn’t, causing a failure. Some defects will always result in a failure if executed, while others will only result in a failure in specific circumstances, and some may never result in a failure.
Errors and defects are not the only cause of failures. Failures can also be caused by environmental conditions, such as when radiation or electromagnetic fields cause defects in firmware.
A root cause is a fundamental reason for the occurrence of a problem (e.g., a situation that leads to an error). Root causes are identified through root cause analysis, which is typically performed when a failure occurs or a defect is identified. It is believed that further similar failures or defects can be prevented or their frequency reduced by addressing the root cause, such as by removing it.
9.3 – Effectiveness, Efficiency and Satisfaction Metrics for the Test Policy
After the test objectives are identified and documented in a test policy, metrics should be defined that measure effectiveness, efficiency, and satisfaction. This section includes examples of such metrics for typical test objectives. Each test project is different, so the metrics that are appropriate for a specific project may vary.
Consider the following typical test objective: Find important defects that could affect customer or user satisfaction, and produce enough information about these defects so developers (or other work product authors) can fix them prior to release. Effectiveness, efficiency, and satisfaction metrics for this objective can include the following:
- Percentage of defects detected (effectiveness)
- Percentage of critical defects detected (effectiveness)
- Percentage of defects rejected by development (efficiency)
- Percentage of critical defects that escaped to production (effectiveness)
- Defect report recipient satisfaction with information delivered (satisfaction)
- Cost per defect found during testing, possibly as a percentage of costs per defect found in production (efficiency)
Consider the following typical test objective: Manage risks by running important tests that relate to key quality risks, in risk order, reducing the risk to the quality of the system to a known and acceptable level prior to release. Effectiveness, efficiency, and satisfaction metrics for this objective can include the following:
- Percentage of critical defects found early in test execution (effectiveness)
- Percentage of critical tests run early in test execution (effectiveness)
- Stakeholder perception of accepted risk prior to release, possibly in comparison to perception of that risk after some period in production (satisfaction)
- Percentage of identified risks covered by (executed) tests (effectiveness)
- Average cost per risk item covered during testing (efficiency)
Consider the following typical test objective: Provide the project team with important information about quality, testing, and readiness to release. Effectiveness, efficiency, and satisfaction metrics for this objective can include the following:
- Survey of project team about sufficiency, importance, and timeliness of information provided by testing (effectiveness and satisfaction)
- Overhead costs associated with producing test reports (efficiency)
Consider the following typical test objective: Find less-important defects, including workarounds for these defects, to enable customer support or help desk to resolve user problems related to these defects if they are not fixed prior to release. Effectiveness, efficiency, and satisfaction metrics for this objective can include the following:
- Survey of customer support or help desk about sufficiency, importance, and timeliness of information provided by testing (effectiveness and satisfaction)
- Stakeholder perception that defect information included sufficient information for appropriate defer/fix decisions (effectiveness)
- Costs associated with delivering information to customer support or help desk staff (efficiency)
For a detailed discussion on derivation of metrics for test objectives, see [Riley & Goucher 09].
The same cautions mentioned in the previous section, regarding unintended side effects and the impact of upstream processes, applies to the metrics discussed in this section.
6.1.3 – Explain How a Test Progress Report is Constructed and Published
The test logs give detailed information about the test steps, actions to take, and expected responses of a test case and/or test suite. However, the test logs alone cannot provide a good overview of the overall test results. For this, it is necessary to have test reporting functionality. After the execution of a test suite, a concise test progress report must be created and published. A report generator can be used for this.
Content of a test progress report
The test progress report must contain the test results, SUT information, and documentation of the test environment in which the tests were run in a format appropriate for each of the stakeholders.
It is necessary to know which tests have failed and the reasons for failure. To make troubleshooting easier, it is important to know the test execution history and who reported it (i.e., generally the person who created or last updated it). The person responsible needs to investigate the cause of the failure, report the defect related to it, follow-up on the fix to the defect and test that the fix has been correctly implemented.
Test reporting is also used to diagnose any failures of the TAF components.
Publishing the test reports
The test report should be published to all relevant stakeholders. It can be uploaded on a website, in the cloud or on the premises, sent to a mailing list or uploaded to another tool such as a test management tool. This helps ensure that reports will be reviewed and analyzed if individuals are subscribed to receive them by email or through chat messages posted by a chatbot.
An option is to identify problematic parts of the SUT, and keep a history of the test reports, so that statistics about test cases or test suites with frequent regressions can be gathered for trend analysis.
Stakeholders to report to include:
- Management stakeholders
- Typical roles: solution or enterprise architect, project/delivery manager, program manager, test manager, or test director
- Operational stakeholders
- Typical roles: product owner/manager, business representative, or business analyst
- Technical stakeholders
- Typical roles: team leader, scrum master, web administrator, database developer/administrator, test leader, TAE, tester, or developer
Test reports may vary in content or detail depending on the recipients. While technical stakeholders may be more interested in lower-level details, management will focus on trends, such as how many test cases were added since the last test run, changes in the pass-fail ratio and the reliability of the TAS and SUT. Operational stakeholders usually put more emphasis on product use related metrics.
Creation of dashboards
Modern reporting tools provide several reporting options through dashboards, colorful charts, detailed log collections and automated test log analysis. There are many available tools in the market to choose from.
These tools support data aggregation from sources such as pipeline execution test logs, project management tools, and code repositories. The visualization of data provided by these tools helps stakeholders see trends and make decisions accordingly. These trends can include defect clusters, increase/decrease in defect propagation to certain test environments, SUT performance degradation, and reliability of builds.
Artificial Intelligence/machine learning analysis of test logs
In recent years, some test automation tools include or are based on machine learning (ML) algorithms. Automated analysis of large amounts of data in test logs helps the TAE reduce time spent finding broken locators, analyzing the reason for test failures (i.e., is it a defect in the SUT or in the TAS?) and grouping common defects for test reporting (see the ISTQB CT-AI Syllabus).
5.2.1 – Using Models to Detect Defects
Modeling provides abstractions of a system at a certain level of precision and detail. It helps stakeholders better understand the system being developed. As discussed below, modeling can support phase containment in at least three ways:
- detecting defects in specifications
- detecting defects in models
- detecting defects in test objects by using model-based testing
Detecting defects in specifications . Specifications are often provided as informally written text. The TA can formally represent these specifications using models. When creating a model, the test conditions (e.g., requirements) are mapped to model elements and linked to them for traceability. Formalization and visualization of the test conditions in a model efficiently reveal defects such as incompleteness, inconsistencies, or ambiguities. The strength of modeling is that the specification is transformed while reviews check it in its original form. As a result, the TA also contributes to finding appropriate solutions for the defects detected.
Data-based models include domain models and combinatorial testing models. They allow the TA to detect domain defects such as overlapping partitions, gaps in the domain coverage, empty partitions, or missing or incorrect combinations of parameters.
Behavior-based models include CRUD matrices, state-based models, or scenario models. They allow the TA to detect incomplete or inconsistent entity lifecycles, missing or faulty state transitions, deadlocks, endless loops, ambiguous or inconsistent system behavior, or missing exception handling.
Rule-based models like decision tables or metamorphic relations allow the TA to detect defects in business rules, such as omissions, inconsistencies, ambiguities, redundancies, error-prone scenarios, or complex business logic.
Modeling can also detect defects such as inconsistencies in naming, data values (e.g., boundaries), and inputs or outputs. It can also identify missing, incomplete, ambiguous, or unnecessary information.
Detecting defects in models . If the test basis contains models, the TA can analyze these models to detect defects. This syllabus discusses defect detection in three typical models used in software testing: state transition diagrams (see Section 3.2.2 ), activity diagrams (see Section 3.2.3 ), and decision tables (see Section 3.3.1 ). Examples of defects in the models mentioned above include:
- state transition diagrams – missing/wrong states, improper transitions, incorrect guard conditions or actions, redundant or unreachable states, and nondeterministic behavior
- activity diagrams – missing, unreachable, or dead-end actions, incorrect order of actions, wrong, non-exclusive, or incomplete guard conditions in decision nodes, missing synchronization points, or improperly synchronized parallel flows that can lead to unintended behavior
- decision tables – overlapping, inconsistent, or infeasible rules, incompleteness (e.g., missing combinations of conditions or missing actions for a given combination of conditions)
All models can also contain defects such as syntax errors, typos, duplicates, and inconsistent naming of model elements.
Detecting defects by using model-based testing (MBT) . In this test approach, an MBT tool designs and generates test cases and other test design testware based on an MBT model and test selection criteria defined by the TA. MBT is effective in finding anomalies in the specification because it allows for comprehensive coverage and systematic exploration of the expected behavior of the test object according to the MBT model. MBT models, especially the graphical ones, foster communication with stakeholders, creating a common perception and understanding of the test basis. More details on MBT can be found in the Model-Based Tester Syllabus (ISTQB-MBT, v1.1).
7.2 – Security Test Reporting
4.2 – Types of Defects in Sound Content
There are three categories of sound content defects:
- No sound,
- Wrong sound,
- Incorrect sound playback.
Missing Sound Effect
No sound is played when it should be, for a certain action of the character or at a certain moment.
Playing the wrong sound
Incorrectly set the sound of the object or the environment, for example, a cannon shot sounds like a pistol shot, a motorboat sounds like a plane, or characters (both in- and out-of-game) say someone else's lines
The sound effect violates historical authenticity, for example, game characters use modern vocabulary, movie and music quotes, the T-34 tank sounds like a T-72 tank. Rare, but can be meaningful if realism and authenticity are stated as a key value of the game under test.
Incorrect playback of the correct sound
Audio drop
When such a defect occurs, some of the reproduced sounds may disappear, as when you're on the phone with a bad connection. Because of this, the player may, for example, misunderstand the meaning of a phrase in a dialogue. If this is the only sound that is currently playing, then testers will easily find the problem. But if several sounds are played at the same time, and one of them disappears, then it is much more difficult to detect such a defect.
Skipping
Skipping in the sound of music or audio effects can be associated with more than just damage to the sound file itself. Skipping is often caused by performance problems. In this case, they occur when the frame rate fails.
Distortion
Due to performance problems, some phrases may sound distorted and inaudible.
Playback Lag
In games, there are moments in which the sound design lags behind the animation, object, or game situation displayed.
Examples of defects in the sound content and their possible causes
1. Lack of sound of the object/environment.
Defect: When moving on a metal surface there is no sound of footsteps, the character moves silently.
Cause: The developer forgot to set up or connect the sound on this surface.
2. The sound of the object or surroundings is too loud/silent.
Defect: A certain object in the location is burning, but the noise from the fire is too loud, or on the contrary, very quiet, which looks unrealistic.
Cause: The volume of the effect is set incorrectly.
3. The sound of the object or environment is set incorrectly.
Defect: While driving a motorboat on the water, the game plays the sound of a racing car.
Cause: An incorrect sound file for the object was written in the code.
4. Incorrect positioning of the sound depending on its source.
Defect: The game has a blacksmith who continually strikes their sword with a hammer, but the sound of the strike is played in another corner of the room.
Cause: In the sound editor, the sound effect is set to the wrong position.
5. Sound coverage area incorrectly configured.
Defect: The sound of a gunshot is heard only within a radius of a couple of meters. If the player moves further away, then the sound is not heard at all, which is not realistic.
Cause: The sound radius is set incorrectly.
6. Sound distortion.
Defect: Players experience the sound beginning to crackle and hiss.
Cause: A corrupted audio file is being used.
7. Continuous repetition of the sound.
Defect: The sound is looped and played continuously.
Cause: A pointer when the sound loop should stop is not set correctly.
8. Sound distortion in the form of "stuttering" playback:
Defect: Distortion of the sound design of the movement occurs during the movement of one of the game characters
Cause: A problem may occur due to problems with the sound assembly or due to the general instability of the game client.
9. Time delay of audio playback.
Defect: During a cutscene, a character starts to speak, but its line is reproduced a little later than when his lips begin to move.
Cause: the animation of the character's lips moving is out of sync with the start of the corresponding sound file.
4.2.4 – Selecting Defects for Causal Analysis
The application of methods described above may require the selection of specific defects for analysis from a potentially large collection. The following approaches can be taken in combination to selecting defects for analysis:
- Pareto analysis (20% of defects considered representative of all)
- Outliers in statistics (e.g., using values of statistical variation, such a 3-sigma, on a particular metric)
- Project retrospectives
- Use of defect severity categories
4.4.2.2 – Post-release Defect Rate
This indicator is defined as the number of defects found by customers during a certain period after release of the product per Kilo Lines Of Code (KLOC). If this rate decreases then the customers‟ perceived quality will increase.
Note: these defect metrics give information for the “manufacturing” view of quality as was discussed in Chapter 2.
5.1 – Defect Prevention Practices
The TA can contribute to defect prevention in several ways, using their domain knowledge, test expertise, and analytical skills. Examples include:
- Participating in risk analysis – ensuring that identified risks are properly mitigated (e.g., selecting the most adequate test techniques).
- Reviewing requirements, models, and specifications – allowing early detection of defects in the test basis preventing them from escaping into the code, thus significantly decreasing the cost of fixing them.
- Participating in retrospectives – allowing the identification of potential improvements in test analysis, test design, test implementation, and test execution (e.g., using more effective test techniques, targeting testing of specific areas of risk, or improving test data and test environments to reduce both false-positive results and false-negative results) to better prevent defects from escaping.
- Defect data collection and evaluation – supporting root cause analysis and process improvement by collecting detailed data on defects to enable their classification and statistical analysis and thus facilitate root cause analysis.
- Participating in root cause analysis – preventing defects from reoccurrence by proposing corrective actions to address the identified root causes.
In addition to participating in defect prevention, the TA assesses (usually in consultation with the test manager) whether the proposed measures have resulted in the desired effect. Examples of metrics that help to evaluate the effectiveness of these measures include:
- Defect removal efficiency (DRE) – measures the ratio of defects removed before the release and the total number of defects. The (unknown) denominator can be estimated or replaced by the total number of defects found up to a certain point in time (e.g., up to 6 months after the release). High DRE indicates fewer defects escape to production, which might imply better defect prevention practices. However, DRE does not distinguish between defects caught through prevention and detection.
- Phase containment effectiveness (PCE) – measures the number of defects introduced and removed in the same phase relative to the total number of defects introduced in that phase. High PCE indicates that fewer defects escape to later phases.
- Cost of quality – illustrates the relation between defect prevention, defect detection, and removal costs (see ISTQB-TM, v3.0, Section 3.2.1).
3.1.2 – Types of Graphic Content Defects
A common category of defects in graphics testing is visual defects. Graphics defects include tearing of the image on the screen, the absence of textures, and the unexpected cropping of certain areas of the image.
When creating graphics and animation for mobile games, the same engines are used as for a PC. The difference is that same engines are adapted for specific platforms, the hardware that is used in them, and their technical capabilities [Gregory18]. Therefore, the defects that occur in such games are similar.
Lack of texture
Among the defects most frequently encountered when testing textures are:
- Lack of graphic objects' textures,
- Loss of textures during gameplay,
- Temporary textures and stubs.
As experience shows, the first two groups of defects are most often related to insufficient performance of graphics processors or outdated graphics card drivers. In comparison, temporary textures may appear due to a development defect.
Level of Detail (LoD)
In a modern 3D game, many objects located at different distances from the camera (from the player's point of view) can be displayed on the stage at the same time. In order to reduce the load on the system, developers use level of detail (LoD) technology.
When developers create a new game object (e.g., a tree, a building, or a car.), they add several variants of object models to the game. These include models with a reduced number of polygons and simplified geometry (low-pole models) and more detailed models with a large number of polygons (high-poly models). Depending on the distance to the camera, models with a different number of polygons are used to display the same object in the game. In close proximity to the camera, when it is required to achieve maximum image quality, high-poly models are used. As the camera moves away, they are replaced with less detailed models with fewer polygons. At a sufficiently long distance, the model is displayed only as a silhouette or is not rendered at all. This allows reducing the number of processed polygons and increasing the performance of the game.
For example, for a forest on the horizon, low-resolution textures can be used with only theit color is displayed, without relief and reflections. If the player gets closer, the trees will appear in full detail.
LoD technology is also used for animations, skeletons and artificial intelligence of bots, where an automated program plays a given game on behalf of a human player. For example, in shooters with a large number of enemies in the frame, bots will have different levels of detail. Bots in the background will be depicted in a simplified manner with low texture detail, whereas nearby opponents will be carefully drawn with elaborate animations and appear smart enough to fight the player.
Developers also change the level of detail depending on the current frame rate, the speed of movement of the object on the screen and the total number of simultaneously visible objects.
The defects arising from the use of LoD are mainly related to the low performance of the system. The developers try to ensure that the increase in the detail of the object or the substitution of the model occurs smoothly and imperceptibly for the player, although this is not always the case. In games running on weak hardware, low-poly models may not be replaced by high-poly models quickly enough. As a result, the player approaching an object will first see an “ugly” model, and then it will change to a better one.
Collisions
Collision is the way in which an object in the game gains size and reacts to collisions with other objects. A collision mesh or collider is created for the finished object model to interact with its environment and other objects. This an invisible simplified form of an object which is tied to it to calculate collisions with other objects. The collider can be called the physical model of the object. It remains invisible to the player, but any collider collisions are handled by the video game engine [Buttfield19].
The shape of the collider should roughly match the mesh of the model, but often a fairly rough approximation is sufficient. For most static objects in the environment such as buildings, rocks and crashed cars, developers use low-poly colliders. This is indistinguishable in gameplay, but improves the processing efficiency of all visible objects.
In this case, the size of the collider must correspond to the visible model, especially if the player can interact directly with this object.
If the collider of the object is much smaller than its visual model, then the character will be able to “fall into the texture” or go through it. Strictly speaking, the phrase “fall into textures” (e.g., when a character can walk through another object) is incorrect, but it perfectly describes what the player sees when his character is partially or completely immersed in another object.
Such failures are most critical in multiplayer games, as it can give the player an illegal gaming advantage. For example, a tank driven into a stone will be virtually invisible to other players. At the same time, such a stone will not protect from enemy fire. This is why testers must pay additional attention to such objects on maps in player versus player (PvP) mode.
Nevertheless, some objects in the game may well be decorative and have no collisions at all. For example, a tank can easily drive through a bush, and the player does not need to be forced to go around or jump over every small pebble or tin can.
Game conventions are applied here. In the same way, one can send a character with a long weapon into a narrow low corridor to fend off enemies attacking from different directions. Unlike real life, the character will be able to turn freely in any desired direction, and will not even notice that, when turning, the spear passes through the walls. Additionally, the character's long hair may go right through the massive shoulder pads of the armor. However, the presence of a low fence, which suddenly prevents the player from climbing, will annoy the player and reduce his enjoyment.
If the size of the object’s collider is larger than the visible model, a situation may arise when the character rests against an invisible wall or stands in the air on a tiny support. Such failures are often used for unplanned fast passing of games. So-called speedrunners are specifically looking for places in locations where the developers were lazy or forgot to resize the colliders of the surrounding objects. Sometimes this allows a player to bypass a significant part of the location and reduce the passage time.
Hit boxes
If it is assumed that a character or game object can take damage, for example, from an enemy bullet / projectile, then during the battle it is necessary to calculate the position of each point on the surface of this object and determine whether there was a hit or not.
For objects of complex shape, this is very expensive and not always justified.
To simplify such calculations, the concept of a hitbox is used. For example, in 2D platformers or fighting games it can be in the form of one or more rectangles. Their position relative to each other is easy to calculate.
For a 3D object, the simplest hitbox shape is a sphere. In this case, it is sufficient to know its center and radius for calculations. In this way, at any given time, it is easy to determine whether a bullet or other object is inside this sphere. However, a parallel piped hitbox is found to be a more suitable shape because it contains less empty space compared to a sphere, and it is sufficient to know the center point of the object and three dimensions: length, width and height for calculation.
For more authenticity, the object can be described by multiple hitboxes, separately for each part of the model: body, (e.g., arms, legs, head, tail, and even weapons).
However, the parts of the model that can be damaged and that can do damage do not always coincide. Therefore, in some games, the hitbox and hurtbox are separately allocated for the same object such that areas that inflict damage (e.g., weapons, fists, etc.) and areas over which damage is inflicted (e.g., head, limbs) are defined. To determine if a character should take damage, it is tested whether the hitbox of the weapon and the hurtbox of the character's body overlap.
The main task of the tester when working with hitboxes will be to test whether the visible area of the impact matches the actual result of the attack.
Even in large games, there are moments when the player clearly sees that his weapon touched the enemy, but did not cause damage. On the contrary, if the hitbox is too large, the enemy's sword might hurt the character even though it passes by visually.
Other defects
When working on a major project, each stage of model production goes through many approvals and confirmations. It is tested by artists, modelers, and texturers, among others. Even then, testers can still detect visual defects that have appeared during the production process.
Inconsistency with the historical prototype
Players may accept unrealistic armor with giant shoulder pads and an implausible appearance of a flying machine in fantasy or science fiction games. However, if the game claims to be realistic, then there are certain to be meticulous players who will indicate that the propellers of certain aircraft models were located completely differently, and there were much more guns on certain battleships.
That is why it is a good idea for the tester to get acquainted with at least a couple of photographs of the tested object, if possible, in order to imagine what it looked like in reality.
Objects hanging in the air
A large number of specialists can work on a location at the same time. Some add or remove objects; others change the geometry of the terrain (map) or fix tiles (textures that are applied to the terrain). Because of this, defects appear when a previously existing object is drowned in a terrain or hangs in the air, because its old "support" was removed.
Visible joint between textures
Such defects are most often found on the terrain of large maps and locations when several textures are mixed. For example, a "seam" might be visible at transitions between a grass surface and sand or stone. For more details see Chapter 3.1.
Destruction of objects
Typically, the model has several states in order to add realism to different situation, such as original, damaged and destroyed. If the game assumes realistic destruction of objects, then a special crash model is created for them, possibly even with its own collision model. At a certain moment, the original model is replaced with a destroyed one.
Here it is important to ensure that the effect of destruction corresponds to the model itself. The destroyed truck should be different from the original one, and the pieces of a broken brick building must not be wooden.
Lighting defects
Lighting defects include:
- Defects in global illumination,
- Defects of point light sources,
- Defects of searchlight light sources,
- Defects of sources having an area,
- Defects in directional light sources,
- Defects in emitting light sources,
- Defects of diffused light sources.
Modern video game engines include very advanced capabilities for creating different types of light sources in full accordance with the laws of optics. However, there are still games where the lighting is not ideal, e.g., due to wrong lighting settings or lack of developer’s experience. Consideration of visual composition (position of light, its angles, colors, field of view, and movement) has a large impact on how players perceive the game environment, and creates the right atmosphere emotionally to engage the player. Designers should take care of this by creating visual integrity. [Lee16], [Tavakkoli18], [Romero19]
Animation defects
This defect results from snapping the skeleton to the model, called skinning. The more bones the model has, the more realistic animation can be created. Different objects can be animated, e.g., the hair of the protagonist.
The bones of a model are dependent on each other. Therefore, when a hand is displaced, the bones of the palm will also move. All subsequent animation depends on how realistically everything was done and set up during rigging and skinning.
If the designer made errors, it could lead to lengthened arms/legs of characters in various animations, and parts of models that are "detached" from the rest of the elements. Often, these failures appear when colliding with other models or in various animations of the model.
Visual effects (VFX) failures
Games often use various effects related to the actions of characters, events and natural phenomena, such as explosions, sparks, smoke, disappearance and appearance.
When working with animations, visual effects are usually attached to bones, helpers (i.e., utility objects that are used to create and animate models), and objects in the scene. Creating visual effects is an iterative process where animation teams and visual effects artists interact. The latter may be asked to make changes or additions to the animation, such as,
- add more keyframes for a smoother trail from the sword,
- rotate the helper to use its rotation as a direction for blood splashes,
- change the camera switching to avoid the ugly look on the particle mesh.
First of all, it is important that such effects are synchronized with the events that produce them. For example, fire and smoke from the muzzle of the gun must be synchronized with the moment of firing and the bullet coming out of the barrel. Otherwise, the realism of the event will be violated. Such occurrences are traditionally considered a failure.
Another problem that causes VFX failures is non-compliance with the technical conditions associated with maintaining the frame rate and optimizing the hardware resources used to correctly display the effect. No matter how large-scale the effect, it is unlikely that the player will be happy to see twitching dust clouds or explosions stuck in time on the screen. As a result, special effects in games are burdened with strict technical limits, the purpose of which is to maintain a certain stable number of displayed frames.
When testing VFX, the tester needs to ensure that the hardware capabilities of the gaming device are being used optimally and that the effects are in sync with the events that trigger them.
It is desirable to find as many defects as possible at the model production stage. For example, exceeding the number of polygons of the model or texturing defects, which significantly increases the load on the hardware used in model calculations. This, inevitably leads to long delays in the game due to the overload of the video adapter processor.
In order to test this, the developer must have received predetermined and fixed requirements for aspects such as LoD and collision models.
Testers, as a rule, find manifestations of these defects, including the breakdowns and failures caused by it. If an object has, for example, a collision model with too many polygons, the defect will not be detected as long as the frame rate is high during interaction with this object.
8.1 – Security Test Reporting
Each security test ends in a test report [ISTQB Glossary ].Without test reporting, test lacks evidence that can be used to determine actions or decisions based on the test result.
The following standard information is important when reporting a failed security test case:
- Used test environment: This usually includes specific IP-addresses, applied IP whitelisting, and used accounts/passwords.
- Preconditions of the executed tests. This includes all preparation activities to be applied before the prepared test suite can be executed. This might include activities such as log-in-details, specific configuration file settings or specific perimeter configurations.
- Used test data
- Procedure of test execution
- Expected results and actual results
A failed security test means a specific test has detected the violation of at least one security aspect from the CIA triad (see Chapter 1). A good test report includes a sufficient level of detail to enable the test to be repeated. Tools used to execute the tests might be named in the test report and screenshots might be included to support the test results with evidence.
In general, security test reports should be handled with high level of confidentiality. If this type of information is leaked outside the organization, it could dramatically reduce the organization’s reputation. Even worse, the information could be used to attack any systems which include this vulnerability.
The more failed tests a security test report contains, the more critical and sensitive the test report and its communication is. In general, every security test report must be communicated with care within the organization. This includes internal communications within the organization producing the SUT, as attackers might come from inside an organization (cf. [SwissCybInst20]). On the other hand, security test reports might be important for many people within an organization. This paradox directly influences the STE’s reporting activities and is usually resolved by creating different versions of the same test report, each of which contains different levels of detail. Each version of the test report should follow the “need to know” concept. This applies to those whose task it is to mitigate identified risks and therefore receive a complete test report or fragments of it based on the “need-to-know” concept.
The sensitivity of a security test report may be modified according to vulnerabilities identified. This is essential when ethical hackers identify a vulnerability in an SUT and wish to inform only the developer to give them the opportunity to mitigate this risk before the test report is made publicly available. This responsible disclosure is one of the characteristics of an ethical hacker, especially for white-hat hackers [Huneidy21]. Grey-hat hackers often use test report publication to increase pressure on an organization to work on patches [Huneidy21].
1.1.3 – Defects Related to Game Testing
There are a number of defects that are especially common in video games. These include:
- problems with graphics and animation
- violation of the physical laws of the video game world.
- defects in the video game artificial intelligence
- inaccuracies in the construction of the video games plot
- incorrect functioning of some interface elements (e.g., video game characters emerging from the air, not attacking enemies, and hovering cars.)
Although such defects may be easy to spot, identifying the exact steps to reproduce them is often difficult. This complexity makes game testing challenging. A good tester should design tests in accordance with the intended game scenario, verify that it meets the specification, analyze possible deviations from the designed scenario, and report on the consequences of these deviations.
Negative testing
When testing games, just like any software, it is important to identify obvious defects and strive to find implicit defects that appear as a result of non-standard actions performed by the user. For example, instead of fighting opponents and looking for a key to a locked door, the user can collect boxes from all over the level, make a ladder out of them, and climb over the fence using them, thus avoiding a tough fight, which was not the intention of the game.
Other defects may occur if the interaction with other objects is set incorrectly, such as for a 3D model of a building used in the game. This type of defect might incorrectly allow a player-controlled character to pass through a wall, which can spoil the overall user experience and give players illegal gaming advantages. This is especially critical in multiplayer games. Hiding behind such a wall, the player will be hidden from opponents, but will be able to shoot at them.
Risks such as these raise the importance of performing negative testing for game projects. There may be a large number of players who do not want to play as the developer intended, but try to “break” or bypass the system in order to win more easily and spend less effort. To achieve this, it is not always necessary to use third-party software or special commands. It may be enough to find the "correct” defect. Such players deliberately look for defects in the logic of the game and use them for personal advantage, such as gaining access to endless resources or powerful weapons. In monetized games, this could also lead to a reduction in the profits of the game owner.
Dependence on the opinion of the players
Gaming software, like no other, depends on the subjective and often emotional judgment of end players. For software designed to solve business problems, its functionality is the most important factor. For gaming software, the most important factor is the user’s level of interest and their impressions of the gaming session. Players might be able to “close their eyes” regarding some functional defects, but if the game turns out to be boring, monotonous or uses outdated graphics, the users may simply may stop using it. A significant portion of the video game audience makes decisions about buying or using a product based primarily on feedback from game critics, reviewers and other opinion leaders.
Multiplatform
An important feature of gaming software is that it is often used on multiple platforms. In an effort to reach as large an audience as possible, game studios/publishers release it on a wide variety of platforms, including various personal computer (PC) builds, web, mobile devices and consoles.
Every update has to be tested for each available platform. This gives rise to serious risks and significantly increases the testing time required.
The game may well run well on a medium-sized computer, but have a wide variety of defects on the latest generation of consoles. Defects are also possible due to inefficient communication between various technologies or incomplete requirements for porting a game from the platform for which it was originally developed to another platform belonging to a third-party (outsourced) organization.
To mitigate these risks, it is recommended to devote more time to developing and testing the game software, testing the functionality and performance of the game on many different hardware configurations, and performing tests based on the specific features of each platform.
Testing of video games on game consoles is a particular aspect to consider. A game console is a device designed exclusively for games and does not contain any other software, like mobile devices or computers.
There are very few differences between platforms when testing video games using black-box test techniques. However, each game console manufacturer may have its own specific requirements that a video game must comply with before it can be published. These requirements are proprietary documents provided to developers and publishers under confidentiality agreements. Each checklist of requirements consists of several categories, and the game must comply with them to avoid being rejected by the console manufacturer [URL1], [URL2].
Therefore, testers of video games on consoles must test for compliance with these requirements in addition to the standard software testing methods.
It may be necessary to use special equipment to detect, identify and understand the reasons for the manifestation of defects. This equipment is essentially the same console, but provides additional modes that help in the development and testing of games. The console is registered on the site for authorized developers and testers, after which it is activated and access to the special modes is granted.
8.2 – Identifying and Analyzing Vulnerabilities
It is important to note that the absence of a failed test suite does not mean that the system is without defects. Even passed test suites do not necessarily mean that the examined attack vector cannot be exploited. It simply states that with the test suites used it is not possible to be exploited by an analyzed attack vector.
If a security test fails, a potential vulnerability is identified. The test report should give all evidence needed to repeat the failed test case. A security test report might demonstrate many vulnerabilities. The following steps must be taken before any remedial action is taken:
- Vulnerability demarcation: Usually a failed test represents a single failed test case and represents one vulnerability. However, several other test cases might exist which show the same vulnerability. For example, if an empty input parameter can be used to take over control of an application, maybe the same behavior can be achieved when using a 100MB file as an input parameter. During the vulnerability demarcation phase, different but similar tests are executed to demarcate the identified vulnerability. This is important for the subsequent risk assessment and must be supported by the STE.
- Adjusting risk likelihood: This step is performed to double-check the risk likelihood of being able to identify a vulnerability in production. Usually, a security test is not performed on a production system. Even if the test environment is similar, it will never be completely identical to the production environment. In particular, some security controls might be explicitly disabled to allow a security test to be performed. If an SUT demonstrates a vulnerability, it might be obfuscated by other parameters put in place for production. If this is the case, the vulnerability still exists but cannot be directly exploited due to other parameters. This adjustment might change the risk level suggested by the security test and might therefore change the overall necessity to plan risk mitigation actions. The STE is tasked with considering this risk adjustment and taking corresponding actions.
- Adjusting risk impact:
This step is performed to double-check the possible risk impact arising from the exposure to a vulnerability. Usually, the STE’s focus is on technical aspects, which makes the calculation of business impact difficult to estimate. Especially if the STE reuses impact assessments for identified vulnerabilities from an outside source (see chapter 4, CVSS), they can be imprecise for a specific context. If a vulnerability is identified, the business stakeholders refine the possible risk impact. The vulnerability may be estimated to have no impact from a business perspective (e.g., if the impacted component is seldom used), or it might be considered to have a high level of business criticality. This adjustment might change the risk level suggested by the STE and warrant an update to planned risk mitigation actions.
If all three of the above steps are applied, a clear view can be obtained of the identified vulnerability and its identified risk. The adjustment of risk likelihood and risk impact must consider some important parameters:
- Close communication with business stakeholders, as they have the final say when discussing possible risk impact
- Close communication with the operations team, as they have the final say when considering production parameters and how they differ from those used in security testing
- Even if the existence of the vulnerability in the SUT is clear, stakeholders may try to actively influence the risk adjustment step (by adjusting likelihood or impact)
If the remaining risk level is considered to be too high to go into production or stay in production, a risk mitigation plan should be created. Management is responsible for deciding about the urgency of such risk mitigation plans. The decision can be between the following levels of urgency:
- Stop operation immediately or stop further go live activities: If the risk level is considered to be too high and cannot be accepted, it can only be avoided by not running the SUT. The level of risk (e.g., high, medium or low) that influences this decision depends on the risk appetite, which is defined as “ the amount of risk that an organization is willing to accept to achieve its objectives ” [CARM22]
- Continue running the system with intensive monitoring: If the system is too critical or the risk is too critical, the SUT might continue running but is intensively monitored
- Add risk mitigation actions to the normal release plan:
If the risk can be handled or the system has many strict release constraints, the risk mitigation actions are analyzed and performed but not directly applied to the SUT. Instead, the patched components are added to the normal release cycle to ensure that the next planned release contains the required security patches.
The STE must ensure that confirmation tests and regression tests are performed for each risk mitigation action. The confirmation test should consider the evidence provided in the test report and should also use the lessons learned from the vulnerability demarcation step.
2.1.5 – Examples of Defects in Game Mechanics and Possible Causes of Their
Game mechanics involve influences on game objects and feedback signaling the result of these influences. Taken together, this creates the unique character of the game, with suitable game dynamics. Most often, games use a wide range of influences and feedback elements.
The following types of defects are associated with game mechanics:
- Functional defects in mechanics,
- Defects of appropriateness recognizability of the game,
- Defects of effectiveness of mechanics manifested in a specific game environment.
Functional defects of the game are mentioned the most when players talk about defects in game mechanics. For example, weapons do not reload, loot is not collected, the image does not get closer when using binoculars. Such defects usually arise from errors made by the developer in the game code. They are quite noticeable and are quite easy to detect and fix.
Defects of appropriateness recognizability of the game are related to getting responses from the game while using a particular mechanic. The situation is incorrect when the player does not understand why the game is over. Therefore, game mechanics are often accompanied by visual and sound effects. This can be the visual effect of an explosion, the sound of a time counter, or even a text message. The very presence of a response when using mechanics is tested and the justification of its presence or absence is assessed. The operation and correctness of the effect is tested by other types of testing (graphics or sound testing).
The third type of defect is related to the effectiveness and scope of mechanics. The mechanics can be effective on their own, but might stop working within the gameplay. To avoid such a situation, mechanics are tested in conjunction with other mechanics, objects, and other necessary content at the game level. Integration testing is therefore conducted together with usability testing to check the effectiveness of the mechanics in the gameplay.
For example, a game designer might add two opponents to the game with different behaviors and characteristics. The first is fast and jumpy, but deals a small amount of damage, and the second is slow, clumsy, but strikes accurately and strongly. In terms of characteristics, both opponents look equal. They have their own advantages and disadvantages. Each can have his own algorithm of behavior, and in theory they should pose about the same amount of danger to the player. However, if a large part of the game level comprises various hills that the player character can climb, the situation changes. Being at a height which is inaccessible to a slow enemy, the player can safely attack the opponent. In this case, the user will have difficulty confronting another enemy, who can also use hills, but moves at high speed and jumps high. The solution to this problem can be both a change in the mechanics itself, and a change in the location of objects on the level.
The complexity of such tests is associated primarily with the difficulty of predicting such situations and how the mechanics will work in them. Therefore, the search for problems of interaction between mechanics and objects of the environment is often carried out as part of ad hoc testing at the beta testing stage with a large group of players.
3.3.2 – Setting Goals and Objectives
Many organizations require that managers set periodic (usually annual) goals and objectives for their team members, which are used to measure the performance of the employee, and which may be tied to the individual’s performance and salary review. It is a Test Manager’s responsibility to work with the individual test team members to mutually agree on a set of individual goals and deliverables, and regularly monitor progress toward the goals and objectives.
If team members are to be evaluated based on meeting their goals and objectives (Management by Objectives), the goals need to be measurable. The Test Manager should consider using the S.M.A.R.T. goal methodology (Specific, Measurable, Attainable, Realistic, Timely).
When setting goals, the Test Manager should outline specific deliverables (what is to be done and how it will be achieved), and a timeframe for when the goal or objective is to be completed (when it will be completed). The Test Manager should not set goals that are unachievable, and should not use goals and objectives that are so simple or vague that they are meaningless. This can be particularly challenging for a Test Manager when tasks can be difficult to measure. For example, setting a goal to complete a set of test cases may not be realistic if the timeframe is too short or if the incoming quality of the software is not sufficient. It is very important that test goals are fair and within the control of the person being evaluated. Metrics such as number of defects found, percentage of test cases passed and number of defects found in production are not within the control of the individual tester. The Test Manager must be very careful not to encourage the wrong behavior by measuring the wrong data. If a tester is evaluated based on the number of defects documented, the Test Manager may see an increase in the number of defects rejected by the developers if the quality of the defect reports is not considered.
In addition to setting individual goals for test team members, group goals may also be established for the test team at large or for specific roles within the test team. For example, a test team goal may be to work towards the introduction of a new tool, complete the training of the test team staff on the tool, and successfully complete a pilot project with that tool. Goals should always roll up to achieve the goals set at higher levels in the organization. An individual’s goals should help support the manager’s goals and so on.
5.3.2 – Purpose, Content and Audience for Test Reports
Test reporting summarizes and communicates test information during and after testing. Test progress reports support the ongoing test control and must provide enough information to make modifications to the test schedule, resources, or test plan, when such changes are needed due to deviation from the plan or changed circumstances. Test completion reports summarize a specific test activity (e.g., test level, test cycle, iteration) and can give information for subsequent testing.
During test monitoring and test control, the test team generates test progress reports for stakeholders to keep them informed. Test progress reports are usually generated on a regular basis (e.g., daily, weekly, etc.) and include:
- Testing period
- Test progress (e.g., ahead or behind schedule), including any notable deviations
- Impediments for testing, and their workarounds
- Test metrics (see section 5.3.1 for examples)
- New and changed risks within testing period
- Testing planned for the next period
A test completion report is prepared during test completion, when a project, test level, or test type is complete and when, ideally, its exit criteria have been met. This report uses test progress reports and other data. Typical test completion reports include:
- Test summary
- Testing and product quality evaluation based on the original test plan (i.e., test objectives and exit criteria)
- Deviations from the test plan (e.g., differences from the planned test schedule, duration, and effort).
- Testing impediments and workarounds
- Test metrics based on test progress reports
- Unmitigated risks, defects not fixed
- Lessons learned that are relevant to the testing
Different audiences require different information in the reports and influence the degree of formality and the frequency of test reporting. Test progress reporting to others in the same team is often frequent and informal, while test completion reporting follows a set template and occurs only once.
The ISO/IEC/IEEE 29119-3 standard includes templates and examples for test progress reports (called test status reports) and test completion reports.
3.1.3 – Quality Reporting for a CI/CD Pipeline
At any given time, it is important to understand the software quality level throughout the SDLC. This provides feedback to the DevOps team on code quality and to product management on release readiness. Integrating quality reporting into the CI/CD pipeline provides the latest development status. Each stage of the CI/CD pipeline creates information for quality reporting. Some quality data is generated automatically by the CI/CD pipeline (e.g., build success, test passed/failed status), while other data comes from manual testing (e.g., user acceptance testing, exploratory testing, or coverage in a test management tool). This information creates a comprehensive view of the software quality.
Quality reporting should occur consistently for each cycle of the CI/CD pipeline and thus be automated. Manual test results should be included in the quality reporting, typically via integration with a test management tool. The information is collected into metrics and combined into a quality report. The quality report can be delivered using various means (e.g., by a dashboard on a wiki page, in a shared tool, as an email or report based on a template, or as a combination of these) ( ISTQB® CTFL , v4.0).
Automated quality reporting requires the integration of several tools. These include various CI/CD pipeline tools’ logging, monitoring, and reporting functionalities (see Section 4.1.2 ). Task management and test management tools record the manual test results (e.g., the estimated quality level of software features or passed/failed test results). Production monitoring tools provide telemetry (see Section 4.2.7 ). Report generators should integrate with all these tools to create easy to understand reports for various stakeholders. Create a single source of truth by combining the metrics information from various sources into a single, accessible location (see Section 3.1.1 ).
The quality reporting implementation process has several steps:
- Determine the key performance indicators (KPIs), and related metrics to track, such as code quality, coverage, performance, build stability, build success rate, deployment frequency, failed deployment recovery time, and security vulnerabilities.
- Collect data using chosen metrics.
- Automate data gathering from various CI/CD pipeline stages.
- Clean and normalize the data for better consistency with data preparation tools (see Section 3.1.4 ).
- Store the collected data in a centralized database if the tools do not provide it.
- Visualize metrics using dashboards, such as charts, graphs, and tables that display the key metrics, including different sections for each stage of the CI/CD pipeline.
- Enable continuous monitoring in the dashboard for real-time updates.
- Ensure the dashboard accessibility for relevant stakeholders, such as developers, testers, product owners, scrum masters, and managers.
A quality report dashboard can enhance a CI/CD pipeline. Benefits include:
- Tracking key metrics continuously for quick response and resolution
- Analyzing CI/CD pipeline performance trends to identify bottlenecks and optimize the CI/CD pipeline efficiency
- Reviewing security compliance status proactively to ensure the codebase meets security standards
- Fostering a culture of transparency and collaboration through shared dashboards with stakeholders, aligning everyone on the project’s quality status and progress
- Supporting retrospectives with data-driven insights to identify areas for improvement
4.2.3 – Use of Standard Anomaly Classifications
Standards such as [IEEE 1044] allow a common classification of anomalies allowing an understanding of the project stages when faults are introduced, the project activities when faults are detected, the cost of rectifying the faults, the cost of failures, and the stage where the defect was raised versus where it was found (also known as Defect Leakage).
A common classification allows statistics about improvement areas to be analyzed across an organization. This classification must be introduced via training, tools and support so that anyone using the incident management system understands when to use the classifications and how to interpret them. This information may be used in the improvement of the development and test process to identify areas where improvement will be cost effective and to track the success of improvement initiatives. The defects to be analyzed will be recorded from all life cycle phases, including maintenance and operation.
7.2.3 – Analyzing Interim Security Test Status Reports
Security test reports may be produced throughout the security testing process or only at the end of security testing (such as at the end of system security testing or at the end of security tests performed as part of acceptance testing). Early security test reporting is encouraged because it allows more time to remediate security vulnerabilities. If the security testing process is following the one described in this syllabus, the test team may discover vulnerabilities and document observations during all test activities.
The structure of a security test report should contain the following sections:
- Report identifier
- Summary
- Executive summary
- Key findings
- Variances
- Test process followed
- Any variances from planned test process
- Methods and tools (configurations, policies) used
- Comprehensive assessment
- Evaluation of test coverage based on the criteria indicated in the test plan
- Explanation for any items or features that were not tested
- Summary of results
- Summarization of the results of security testing
- List of all resolved security vulnerabilities and their resolutions
- List of all unresolved vulnerabilities
- Evaluation
- Evaluation of the observed test results and their status based on exit criteria
- Risks identified (classifications) and impact of unresolved security vulnerabilities
- Summary of activities
- Approvals
The effectiveness of security testing reporting depends on the following:
- The timing of the report
- The content of the report
- The recipients of the report
- The tuning of the content to match the recipients’ need for the information
Multiple reports may be required to meet the needs of various stakeholders. For example, the content of a report for executive management will not be the same as the content for a system architect.
4.4.3.3 – Early Defect Detection
As stated in the previous performance indicator, the efficiency of the defect removal process will increase if defects are found earlier in the process. Not only is this applicable for static versus dynamic testing but also for unit and integration versus system and acceptance testing. The performance indicator „Early Defect Detection‟ measures the total number of defects found during unit and integration testing (early dynamic testing) versus the total number of defects found during dynamic testing.
2.3.4 – Defect Management Challenges in Hybrid Software Development
In practice, multiple teams often collaborate on the delivery of the system or system of systems. Examples include hybrid software development when a customer uses Agile software development and one of their suppliers uses a sequential development model, or when an organization using a sequential development model requires delivery of a subsystem from a team using Agile software development. Such a multi-team environment poses various challenges:
- Alignment on defect attributes and tools to be used for defect management: In an ideal scenario all teams use one defect management tool. In practice it is common for each team to use a different defect management tool, especially when several supplier teams contribute to project delivery. In such cases it is good to establish synchronization between the defect management tools (preferably automatically).
- Prioritization of defects: The product owner(s) should be included in defect management meetings and actively seek information about consequences and risks associated with defects. Defect management meetings should be held more often with Agile software development than in sequential development models to keep pace with the Agile team’s faster rate of product increment delivery. These meetings may, however, be shorter with Agile teams. Sometimes it is beneficial for a smaller group of defect management stakeholders to have the final word about prioritization of defects.
- Alignment and transparency of the test plan for new development and defect fixes : All teams’ work should align to the same project plan irrespective of whether they are using Agile software development or sequential development models. All deliverables, including defect fixes, should be aligned with this project plan. Better alignment can be achieved by active participation of the members of all teams in the planning process (e.g., participation of sequential development model teams in Agile software development meetings where defects are discussed and prioritized). Transparency of development plans can be improved by sharing them between teams (e.g., via dashboards, or via the Product Backlog).
5.1.2 – Understanding the Types of Defects in Level Design
There are a number of defects that are most common when creating levels. Tracking such defects can be difficult, so they can remain unnoticed at the level for some time.
Some dedicated map creation tools have built-in functionality to detect such defects on maps. Level designers often use these tools in the final stages of creating a map or level. But in most cases, the best way to find defects on a map is to test it by experienced players who are able to detect the problem and report it.
A significant proportion of the defects found at the levels are related to the appearance and location of game objects, their lighting, collision model, etc. A detailed description of such defects is given in Section “3. Graphics Testing”.
However, the following defects directly relate to the design of the levels.
Geometry
Geometry defects are situations where the player's character is partially stuck in some parts of the level / map. As a rule, such defects are found on the edges of the map, ledges, slopes. The player guides their character into an object or walks close to an object and gets stuck in it. Often, with the help of jumping, bending and other movements, the character manages to get out of such a situation, but in some cases this does not help. In these instances, the player has to restart the level/map, return to the last progress save point, or use a special button/keys combination to move to the nearest location without collision defects.
For example, a game character can get stuck in the geometry of the map, unable to get out, or into areas that should be denied access. It is especially important to identify such defects in multiplayer games, where level defects can put one player or one team in a better position.
Another common situation is death when being stuck, namely, the character visually falling under the surface of the level / map and falling down. Ultimately, the character either dies and the level has to start again, or falls endlessly in the void, and the game has to be restarted.
Inaccessible places
In video games, especially on maps in multiplayer games, there may be intentional locations in which the player gets a better position than other players. For example, a machine gunner on a hill will have a large firing sector. Although the player who is the first to take such a position gains some advantage over opponents, this is an intention of the developer, a design element of the level, and not a defect.
But there are situations when such a place is created by accident due to an error by the level designer. According to the developer’s concept, this area should be inaccessible to players. However, a certain game character with the help of its unique features (e.g., higher jumps than the rest) may end up in it. In this way, the player can gain an illegal gaming advantage over their rivals. For example, other players will not be able to detect it, damage it, etc.
Complicated gameplay
Problems associated with the lack of goal pointers or the non-obviousness of the required actions to complete the level. For example, the player has defeated all opponents in the accessible territory, but cannot understand what else needs to be done in order to go further.
Game balance level
A lot of defects arise in setting the level balance. For example, bot opponents that are too complex at the current stage of the game, and which completely exclude the possibility of passing this level. In other games, several teams try to get to the desired point of the point map before the opponents. Here, the defect in the level balance might be unequal starting conditions for the teams.
Inappropriate restrictions and conventions
These problems do not affect the gameplay and do not provide a game advantage, but they degrade the perception and immersion in the game.
For example, the player sees that the character's path is blocked by a waist-high fence, but it is impossible to get over it. As planned by the level designer, this place is an area inaccessible to the player, and that's how it is supposed to be. But from the player's point of view, this situation looks like a defect that ruins the immersion in the game. Similarly, the player will consider as a defect a situation when the character is locked behind bars and cannot get out, although he sees that the distance between the rods is large enough.
Narrative
Level defects associated with a violation of the general style of storytelling, the plot of the game. The impact of such defects is minimal on the gameplay itself, however, they negatively affect the user's immersion and the general perception of the game. For example, if a character finds itself in a city that, according to the plot, was subjected to a nuclear bombardment, the appearance of intact buildings in it will cause dissonance.
Changing the color coding of objects
Objects encountered by the user during the game have different properties. Some of them are decorations, and with others the player can interact. Color-coding objects with different properties is an important part of level design. Therefore, it is desirable that once adopted color coding does not change throughout the game.
For example, a player discovered a red barrel at the level, which exploded from a shot. If a player encounters such a barrel again, they will expect the same behavior from it. Therefore, all barrels that explode from a shot must always be of the same color (usually red).
Boxes that the player can break, doors that the player can open, rocks and ledges that the player can grab onto and climb over, etc. should be different in shape and / or color from other objects.
Otherwise, the player will be forced to spend more time understanding what to do next.
6.1.2 – Defects Related to the Specifics of Game Controllers
The causes of defects associated with controllers can be different. The appearance of defects can be caused by the software itself, the marriage of controller components, and even the developer's failure to comply with the instructions for using the controller from the manufacturer:
- Outdated controller driver,
- Controller model incompatibility with application,
- Defect of an individual device or the entire batch,
- Inconsistency of the gameplay with the instructions.
The most common defect is the lack of replacement or the complete absence of a tooltip when switching controllers during the game. Key bindings may vary from game to game. They can also be reassigned by the player at their own discretion.
An outdated version of drivers or their absence can lead to the fact that the controller does not work as expected. If software defects can be eliminated by updating, then technical malfunctions and shortcomings of controllers can be corrected only by releasing their new revision.
However, an inaccuracy in reading the movement of a racing wheel or any other controller can arise from a hardware defect or a defect in software calculations. For games where the accuracy of reading the control signals of the game controller is critical, the video game design document must contain the required values in degrees of inclination.
Also, when releasing a video game on a popular platform, the platform owner can provide requirements for the in-game images of their controller. In-game images are the controller images used in the game. For example, it can be a schematic representation of a gamepad in the key binding settings menu or in tips for gameplay. Images can not only be inside the game; controllers can also be displayed on software packaging or on a digital cover. This requirement usually applies to well-known publishers and simultaneously manufacturers of consoles and controllers. Corporations, in their test documentation for game developers, may provide requirements for how controllers should be depicted in an application, including both outlines and trademarks.
Also, for video games where the accelerometer and gyroscope of the controller are used, the platform owner imposes security requirements. The simplest example would be the need to make waving with controllers to implement the gameplay. The motion sensors inside it allow it to be used as a control in 3D space. In such cases, it is required to indicate before starting the game, that the user needs to put on the holding straps that are attached to the controllers. Otherwise, by making sudden movements with the controllers, they can slip out of the user's hands and damage the surrounding equipment or, even worse, become a health hazard.
6.1.2 – Analyze Data from the Test Automation Solution and the System Under Test to Better Understand Test Results
After test execution it is important to analyze the test results, to identify possible failure(s) both in the SUT and the TAS. For such an analysis the data collected from the TAS is primary and the data collected from the SUT is secondary.
- Analyze the test environment data to support proper sizing of test automation (e.g., in the cloud)
- Clusters and resources (e.g., CPU, and RAM)
- Single versus multi browser (i.e., cross-browser) test execution
- Compare test results of previous test executions
- Determine how to use web logs to monitor software usage
Test execution failures need to be analyzed, as there are potential issues:
- Check if the same failure happened in the previous test executions. This might be a known defect either in the SUT or the TAS. The TAS can be built to log historical test results of the test cases, thus further helping the analysis.
- If the defect is not known, identify the test case and what it is testing. The test can be selfexplanatory, or the test case can be identified in the test management system, based on its ID logged with the test execution.
- Find in which test step of the test case the failure happened. The TAS logs this.
- Analyze the test log information about the state of the SUT and whether it matches the expected results using screenshots, API and network logs, or any log that shows the state of the SUT.
- If the state of the SUT is not what was expected, log a defect in the defect management system. Make sure to include all the necessary defect information and the logs that justify that it is a defect.
When there is a failure, it is possible for the actual result and the expected result of the SUT to match. In this case, most likely the TAS contains a defect which needs to be fixed, or an invisible mismatch is present.
Another situation that can occur is if the test environment is not available during the test run, or only partially available. In this case, all test cases can fail, either with the same defect or if parts of the system are down, with seemingly real failures. To identify the root cause of such defects, the SUT logs can be analyzed, which will show if there were any test environment outages at the time of the test run.
If the SUT implements audit logs for user interactions (i.e., UI sessions or API calls) it helps to analyze test results. There is usually a unique ID added to the interaction with the same ID for each subsequent call and integration in the system. In this way, knowing the unique ID of a request/interaction, the behavior of the system can be observed and traced back.
This unique ID is usually called a correlation ID or trace ID. This can be logged by the TAS to help analyze test results.
5.3 – Mitigating the Recurrence of Defects
A TA can proactively help minimize the recurrence of defects into the software. This syllabus discusses two approaches related to mitigating the recurrence of defects: analyzing test results to improve test analysis and test design and supporting root cause analysis with defect classification.
3.6.6 – Hardware integration defects
Hardware integration defects are often found in the following areas:
- BNA
- Hopper payouts
- Edge lighting
- Printers
- Coin acceptors
- Light tower functionality
- Topper
- LCD buttons
- Cabinet door
- Monitor and touch screens
- Mechanical reels
- Firmware
- Drivers
4.2.2 – Causal Analysis during an Inspection Process
The inspection process is described in the ISTQB Foundation syllabus and expanded in the ISTQB Advanced syllabus. Using the software inspection process [Gilb & Graham] suggests a different approach to causal analysis.
The causal analysis meeting is a facilitated discussion which lasts two hours and follows a set timescale and format.
- The selection of defects to be considered may be taken by the inspection leader or in the context of a project retrospective. Alternatively the issues to be discussed may identified in the first part of the analysis.
- Part 1: Defect analysis (90 minutes) looks at specific defects and their specific causes
- Part 2: Generic analysis (30 minutes) focuses on identifying broad trends in the defects. The team looks for trends, commonalities and what has recently gone well, improved or gone wrong. Defect taxonomies (introduced in the Advanced syllabus) can be a valuable support for this analysis. Generic analysis may also focus on particular defects found in dynamic testing to provide risk-based inputs for the future testing strategy.
- The discussion must ensure that the number and severity of the defects being considered maximizes the return on the invested time.
In the defect analysis, each defect is categorized with:
- A defect description - this is not the defect symptom but the defect itself
- A cause category - e.g., communication, oversight, education, transcription error, process
- A cause description - for the cause and any chain of cause events
- The process step when the defect was created - this is not always where it was detected
- Suggested actions to eliminate the cause - these must be specific and achievable
7.5.1 – Planning, Monitoring and Control
From the Advanced syllabus, test planning involves the identification and implementation of all of the activities and resources required to meet the mission and objectives identified in the test strategy. Test monitoring and control are ongoing activities. These involve comparing actual progress against the plan, reporting the status and responding to the information to change and guide the testing as needed.
- Metrics for the test planning, monitoring and control processes
- Risk coverage
- Test case development and execution status
- Defect discovery trends
- Planned versus actual hours for testing activities
- Interpreting the data
- Adherence to the estimated schedule and budget is critical to all test projects. These metrics can be used to quickly determine the planned versus actual status of the testing processes.
- Quality of the software can be determined based on the expected versus actual defect discovery trends. Finding more defects, or a larger proportion of critical defects, at a higher rate than was anticipated can indicate significant incoming quality issues.
- Properly sequenced risk mitigation can be determined by checking that the team has created and executed tests for the highest risk items prior to the lower risk items. If lower risk items are being addressed first, the testing approach needs to be reviewed and corrected.
- Insufficient test progress is sometimes due to insufficient productive test hours. If the planned versus actual test hours is not meeting expectations, test coverage will be insufficient and the project will quickly start to slip the schedule. The Test Manager must carefully investigate the causes of the lack of progress to determine which factors are occurring (test systems not ready, insufficient incoming quality, test documentation not prepared, resources not available, etc.) and create a plan to rectify these problems.
3.1.2 – Gambling and wagering functional testing defects
When performing gambling and wagering functional testing there are specific areas to target. Examples of these areas include the following:
- Game rules
- Digital graphics – hardware video components
- Graphics – image components
- Digital software
- Accounting - money wagered on a game is correctly accounted for
- Game or player history
- Pay tables
- Game play
- Menus
- Audio components
- Peripherals
- Help files
- Overall game fun or player perspective
The types of defects that are often found in the above areas include, but are not limited to the following examples:
- Documentation does not comply with the game specifications
- Game rules are not followed
- Graphics, both video and images, are not synchronized with the game and do not follow game specifications
- Audio is not synchronized with the game and does not follow game specifications
- Game software stops or does not work correctly
- The player history, what the player put in the machine and their results are not accurate
- Menus and help files are wrong versus the game specifications
- When two buttons are hit simultaneously by accident the game does not handle the situation as expected
- The game does not play well and provides pleasure to the player
- Game does not pay the correct amounts of money as per the game specifications
- There are loopholes in the game where someone can change the software or cheat
- Legal specifications in each jurisdiction have not been met where the game will be played
- The game does not handle the loss of power as expected
1.6.5 – Tool Metrics
Objective metrics from tools are designed and collected based on the needs of the test team and other stakeholders. Test tools mostly capture valuable real-time data and reduce data collection efforts. This data is used to manage the overall test effort and identify areas for optimization.
Different tools are focused on collecting different types of data. Examples of these include:
- Test management tools can supply a variety of different metrics related to available test items, tests, planned tests as well as current and passed test execution status (e.g., passed, failed, skipped, blocked or planned)
- Requirements management tools deliver traceability regarding requirements coverage by passed and failed test cases
- Defect management tools can provide defect information such as status, severity, priority and defect density of test items. Other valuable data, such as the defect detection percentage, the test levels at which defects are introduced and detected defect lead time help to drive process improvement, but may not all be provided solely by the defect management tool.
- Static analysis tools, among others, supply metrics related to code complexity
- Performance testing tools can supply valuable information such as response times and failure rates under peak loads
- Code coverage tools help to understand which parts of the test object have been exercised by testing
- Although test tools can be used to collect metrics, they should also monitor themselves. In this context the quality of the test process can be measured (e.g., the number of defects found with and without tools and requirements coverage)
- Test efficiency (e.g., duration of test execution and number of executed tests)
More details on the collection and usage of metrics can be found in Section 2.1 of this syllabus, Test Metrics.
5.5 – Analysis of Findings
Analysis of findings is the process that extracts findings from observations during usability test sessions.
The following steps are performed:
- During the usability test session, the note-taker records usability observations, usually by writing them down. Usability observations reflect events that cause problems with or have a positive effect on effectiveness, efficiency and satisfaction.
- After each usability test session (while everyone still remembers what happened), the notetaker and the moderator meet and have a candid discussion about the observations taken from the usability test session.
- After all usability test sessions have been completed, the moderator and the note-taker separately extract between twenty and thirty usability findings and between five and ten positive findings each from their observations. These findings reflect the observations that they consider most important.
- The moderator and the note-taker meet again and have a candid discussion about their findings. The findings are merged into a common list consisting of between twenty and thirty usability problems and five and ten positive findings.
- The moderator logs the problems in the common list on the company’s usability problem tracking tool, which ideally is the same as the defect tracking tool.
- The moderator tracks the problems to resolution and reviews the implemented solution. If the implemented solution represents a risk, it should be subject to another usability test.
Several points are of particular relevance to the analysis of findings:
- Candid discussions between the moderator and the note-taker (as mentioned in steps 2 and 4), are of essential importance to the success of the analysis. These discussions must be honest and based on observations rather than on personal opinions.
- It is important that a usability test report is usable, so the number of reported findings must be limited (the values shown in point 3 above are rules of thumb). For example, if seventy usability problems are found, it is unacceptable to simply report all of them and leave it up to the stakeholders to process them.
- It is a critical (and sometimes inconvenient) task for the moderator to prioritize the findings and report only the ones that are most important from a usability point of view.
- Comparisons of the findings between the current usability test and previous usability test reports will help detect trends and frequently occurring usability problems.
4.1.2 – Identify Ways in Which Test Automation Helps Verify Reported Defects
Confirmation testing performed following a code fix can address a reported defect. A tester typically follows the test steps necessary to replicate the defect to verify that the defect no longer exists.
Defects have a way of reintroducing themselves into subsequent releases (e.g., this may indicate a configuration management or code repository management problem) and therefore confirmation tests are suitable candidates for test automation and can be added to the existing regression test suite.
An automated confirmation test typically has a narrow scope of functionality. Implementation can occur at any point once a defect is reported and the test steps needed to replicate it are understood.
Tracking automated confirmation tests allows for reporting the time and the number of test cycles expended in resolving defects.
By verifying fixes across multiple platforms, devices, browsers, and OS versions with test automation, the amount of time spent on testing is greatly reduced.
8.3.3 – Hardware/Software and Embedded Systems
Hardware/software combination projects and embedded systems projects require some specific planning steps. In particular, because the test configuration tends to be more complex, more time should be allotted in the schedule for set up and testing of the test configurations. Prototype equipment, firmware and tools are often involved in these environments, resulting in more frequent equipment failure and replacement issues that may cause unexpected downtime. The testing schedule should allow for outages of equipment and provide ways to utilize the test resources during system downtime.
Dealing with prototype equipment and prototype tools such as diagnostics can further complicate testing. Prototype equipment may exhibit behavior that the production models will not exhibit and the software might not be intended to handle that aberrant behavior. In this case, reporting a defect might not be appropriate. Anytime pre-production models are used in testing, the test team must work closely with the hardware/firmware developers as well as the software developers to understand what is changing. One word of caution though, this can work the other way. Prototype hardware may exhibit incorrect behavior and the software may accept that incorrect behavior when it should raise an error. This will mask the problem that will only appear with the properly working hardware.
Testing these types of systems sometimes requires a degree of hardware/firmware expertise in the testing team. Troubleshooting issues can be difficult and time consuming, and retesting time can be extensive if many releases/changes occur for the hardware and the firmware. Without a close working relationship and an awareness of what the other teams are doing, the continually changing hardware/firmware/software can destroy the forward progress of the testing team due to the repeated integration testing.
An integration strategy is important when testing these types of systems. Anticipating and planning for problems that may hinder the integration helps to avoid project delays. An integration test lab is often used to separate the untested equipment/firmware from the software testing environment. The equipment/firmware has to "graduate" from the integration lab before it can enter the system testing phase.
The Test Manager plays an important role in helping to coordinate the schedules of the components so that efficient testing can occur. This usually requires multiple schedule meetings, frequent status updates, and re-ordering of feature delivery to enable testing while also supporting a logical development schedule.
6.3.5 – Analysis of Results
If an analytical approach to improvement is being used (Chapter 4), the current situation may be analyzed by applying concepts such as:
- Systems Thinking [Weinberg 92]
- Tipping Points [Gladwell]
Systems Thinking helps analyze the relationships between different system (process) components and to represent those relationships as stable (“balancing”) loops or reinforcing loops. A reinforcing loop may have a negative effect (“vicious circle”) or a positive effect (“virtuous circle”).
Tipping Points help identify specific points in a system where a small, well-focused improvement may break a vicious circle and set off a chain reaction of further improvements.
When a model-based approach (Chapter 3) for test process improvement is followed, a comparison is made between the process maturity of the current situation and the desired objectives defined at the initializing phase.
Where appropriate benchmarks are available, these should be used in evaluating results. The following benchmarks may be used, where available:
- Company-based, representing an entire organization
- Industry-based, where possible relating to the same business segment
- Project-based, where the comparison is made with a specific project that is regarded as meeting the desired objectives
Where key performance indicators have been established (see Section 4.4 and Section 6.2.2), these should be incorporated into the analysis. For example, if the Defect Density Percentage (DDP) has fallen below the required level, an analysis of faults found in production should be performed to evaluate their sources.
The result of the evaluation should provide sufficient information with which to define recommendations and support the planning process (see Sections 6.3.7 and 6.4 below).
5.4.1 – Analyze Test Report Data to Inform Decision Making
The format and the content of a test automation report may vary depending on the stakeholders receiving it. It can be created for management, operational or technical stakeholders. Additional information can be found in the CTAL-TAE Syllabus, section 6.1.3.
Upon receiving a test automation report, it can be incorporated into a broader test report, or it can be consolidated, and then escalated within the organizational structure.
Different stakeholders find different values in such a test automation report. A strategic approach is to identify key metrics that are important for the stakeholders involved by emphasizing these important metrics.
Data collected with automation can help:
- Identify trends and perform root cause analysis
- Shift test automation efforts to maintenance
- Shift test automation efforts to improvements and further development of a TAF
- Add capabilities to the overall TAS
- Increase shift left and shift right approaches to testing
- Expand the functional coverage of test automation in future sprints
- Focus more on defect clusters
- Advise developers of areas to improve the code
- Advise on the overall SDLC processes
- Change the content and format of future test automation reports
Based on the information described above, the TAEs in collaboration with other stakeholders can identify gaps and certain improvement points in the existing test automation coverage and test results.
6.3.7 – Recommending Improvement Actions
An assessment report must relate results to the specified test improvement objectives. The report must be delivered as soon as possible after completion of the assessment, possibly as a preliminary version followed later by a complete version.
As a minimum, the assessment report must include:
- A management summary which refers to the vision statement (see Section 6.2.2.1) A statement of scope and objectives
- Results of the analysis including
- Positive aspects
- Aspects which need improving
- Open issues
- A list of improvement recommendations
Where possible, recommendations should be thought of as improvement requirements (e.g., “provide tool support for a defect tracking system”) which may be implemented in a number of different ways (e.g., “use tool XYZ and provide training”). The implementation task is covered in Section 6.5.
An improvement recommendation should include the following information:
- A unique identifier (for traceability)
- The impact of the recommendation on one or more stated objectives (where possible using a scale to indicate the degree of fulfillment, such as “minimal”, “partial”, “full” or a percentage value)
- Estimate of cost and benefits
- Implementation timescale (e.g., short-term, medium-term, long-term)
- Risks of implementation (e.g., high level of resistance expected in the change process, risks to achieving particular improvements)
- Dependencies and assumptions (e.g., assumes that another recommendation is also implemented)
To assist in the planning and tracking of high-level recommendations they should, where possible, be broken down into small steps of improvement with tangible results.
Some process models, such as TPI Next, include specific improvement suggestions to help in the task of creating recommendations.
6.1.1 – Apply Data Collection Methods from the Test Automation Solution and the System Under Test
Data can be collected from the following sources:
- SUT logs
- Web/mobile UI
- APIs
- Applications
- Web servers
- Database servers
- TAF logs to provide an audit trail
- Build logs
- Deployment logs
- Production logs to monitoring data in production (see the ISTQB CT-PT Syllabus, section 2.3)
- Performance monitoring in production to perform trend analysis
- Performance efficiency test logs in a performance test environment (e.g., load, stress, and spike testing)
- Screenshots and screen recordings (native to the automation tool or 3rd party)
Since a TAS has automated testware at its core, the automated testware can be enhanced to record information about its use. Testware enhancements made to the underlying testware can be used by all the higher-level automated test scripts. For example, enhancing the underlying testware to record the start and end time of test execution may well apply to all tests.
Features of test automation that support measurement and test report generation
The scripting languages of many test tools support measurement and reporting through facilities that can be used to record and log information before, during, and after test execution of individual tests, and entire test suites.
Test reporting on each of a series of test runs needs to have an analysis feature to consider the test results of the previous test runs so it can highlight trends, such as changes in the test success rate.
Test automation typically requires automating both the test execution and the test verification, the latter being achieved by comparing specific elements of the actual results with the expected results. This comparison is best done by a test tool using assertions. The level of information that is reported as a result of this comparison must be considered. It is important that the test status be determined correctly (i.e., passed or failed). In the case of failed status, more information about the cause of the failure will be required (e.g., screen shots).
Differences between actual results and expected results of a test are not always clear, and tool support can help greatly in defining comparisons that ignore differences that are expected, such as dates and times, while highlighting any unexpected differences.
Test logging
Test logs are a source that is frequently used to analyze potential defects within the TAS and the SUT. In the following section are examples of test logging, categorized by TAS and SUT.
TAS logging
The context determines whether the TAF or the test execution is responsible for logging information that should include the following:
- Which test case is currently under test execution, including start and end time
- The status of the test execution because, while failures can easily be identified in test logs, the TAF should also have this information and should report via a dashboard. The test execution status can be either passed, failed, or a TAS failure. Status can sometimes be inconclusive and it is important for an organization to define clear and consistent definitions for them. A TAS failure is applied to situations where the defect is not in the SUT.
- Low-level details of the test log (e.g., logging significant test steps) including timing information
- Dynamic information about the SUT (e.g., memory leaks) that the test case was able to identify with the help of third-party tools. Actual results and failures should be logged with the test suite that was executed when the failure was detected.
- In the case of reliability testing or stress testing where numerous test cycles are performed, a counter should be logged to easily determine how many times test cases have been executed.
- When test cases have random elements (e.g., random parameters or random test steps in state transition testing), the random number/choices should be logged.
- All actions that a test case performs should be logged in such a way that the test logs, or parts of it, can be played back to re-run the test with the same test steps and the same timing. This is useful to reproduce an identified failure and to capture additional information. The test case action information can also be logged by the SUT for use when reproducing customer identified failures. If a customer runs a test suite, the test log information is captured and can then be replayed by the development team when troubleshooting a defect.
- Screenshots can be saved during test execution for further use during root cause analysis.
- Whenever a test suite initiates a failure, the TAS should make sure that all information needed to analyze the defect is available/stored, as well as any information regarding the continuation of testing, if applicable. The TAS should save any associated crash dumps and stack traces. Also, any test logs which can be overwritten (e.g., cyclic buffers are often used for test logs on the SUT) should be stored where they will be available for later analysis.
- Use of color can help to distinguish different types of test log information (e.g., defects in red, and progress information in green).
SUT logging
Correlation of the test automation results with SUT logs to helps identify the root cause of defects in the SUT and the TAS.
- When a defect is identified in the SUT, all necessary information needed to analyze the defect should be logged, including date and time stamps, source location of the defect, and error messages.
- At the startup of a system, configuration information should be logged to a file, consisting of, for example, the different software/firmware versions, configuration of the SUT, and configuration of the operating system.
- Using test automation, SUT logs can be easily searchable. A failure identified in the test log by the TAS should be easily identified in the test log of the SUT, and vice versa, with or without additional tools. Synchronizing various test logs with a time stamp facilitates correlation of what occurred when a failure is reported.
Integration with other third-party tools (e.g., spreadsheets, XML, documents, databases, and report tools)
When information from the execution of automated test cases is used in other tools for tracking and reporting (e.g., updating traceability information), it is possible to provide the information in a format that is suitable for third-party tools. This is often achieved through existing test tool functionality (e.g., export formats for test reporting) or by creating customized reporting that is output in a format consistent with other software.
Visualization of test results
Test results can be made visible using charts. Consider using colored icons such as traffic lights to indicate the overall status of the test execution/test automation so that decisions can be made based on reported information. Management is particularly interested in visual summaries to see the test results, which aides in decision making. If more information is needed, they can still drill down into the details.
8.3.2 – Avoiding a Vulnerability
Generally, avoiding the vulnerability is a very time consuming and expensive action. The following steps must be performed to avoid a vulnerability:
| Step | Description | ||||
|---|---|---|---|---|---|
| Locate the vulnerability | • As the risk mitigation action must be taken at the level used to implement the functionality (e.g., code, models, and configurations) it might take time to identify the affected component and within that component the affected area based on an identified vulnerability at the system level | ||||
| Understand the vulnerability | • Before making a repair, a full understanding of the vulnerability must be obtained by analysis of the vulnerability in the affected area (e.g., code snippet) | ||||
| Identify the risk mitigation action | • An approach for risk mitigating must be developed. • The mitigation action might consist of a completely new algorithm, a new component, a small configuration change or only some minor code adjustments (e.g., including a specific exception behavior). | ||||
| Execute the risk mitigation action | • The identified risk mitigation action is applied. | ||||
| Confirmation test | • Perform a confirmation test on the system to test if the vulnerability has been eliminated. | ||||
| Regression test | • Testing is a fundamental part of avoiding vulnerabilities and should not only focus on the changed code. It is essential that the complete regression test suite is executed to make sure that the system is still running correctly, and the mitigation action has had no unwanted side effects. | ||||
| Deploy | • Deploy the patched system. • After the system is deployed there is usually some close monitoring for a period to be sure that the system is running well. |
4.4.1 – Introduction
Measures, metrics and indicators form part of all improvement programs. This applies regardless of whether these improvements are carried out formally or informally. It is also regardless of whether the data are quantitative or qualitative, objective or subjective. The feelings of the people affected by the improvement are a valid measure of progress toward improvement.
Measures, metrics and indicators initially help to target areas and opportunities for improvement. They are required continuously in improvement initiatives in order to control the improvement process and to make sure that the changes have resulted in the desired improvements.
Measures, metrics and indicators can be collected at all stages of the software life cycle, including development, maintenance and use in production [Nance & Arthur 02]. They are also used for deriving other metrics and indicators. Note that for all items mentioned in Section 4.4.2 which relate to defects, it is important to make a distinction between the various priority and severity levels of the defects found. Specific measures, metrics and indicators may also be applied by test managers, in particular for the project level tasks of test estimation and for progress monitoring and control. Test process improvers will apply measures, metrics and indicators at the process level.
4.4.3 – Testing for Availability
Availability is typically specified in terms of the amount of time a system (or software) is available to users and other systems under normal operating conditions. Systems may have a low maturity, but still have a high availability. For instance, a phone network may fail to connect several calls (and thus have low maturity), but as long as the system recovers quickly and allows the next attempts to connect most users will be content. However, a single failure that caused a phone network outage for several hours would represent an unacceptable level of availability. Availability is often specified as part of an SLA and measured for operational systems, such as websites and software as a service (SaaS) applications. The availability of a system may be described as 99.999% (‘five nines’), in which case it should be unavailable no more than 5 minutes per year, alternatively system availability may be specified in terms of unavailability (e.g., the system shall not be down for more than 60 minutes per month).
Measuring availability prior to operation (e.g., as part of making the release decision) is often performed using the same tests used for measuring maturity; tests are based on an operational profile of expected use over a prolonged period and performed in a test environment as close to the operational environment as possible. Availability can be measured as MTTF/(MTTF + MTTR), where MTTF is the mean time to failure and MTTR is the mean time to repair (MTTR), which is often measured as part of maintainability testing. Where a system is high-reliability and incorporates recoverability (see section 4.4.5) then we can substitute mean time to recover for MTTR in the equation when the system takes some time to recover from a failure.
2.1.2.6 – Traceability in ASPICE
As in the CTFL® Core Syllabus [ISTQB_FL_SYL], ASPICE additionally requires bidirectional traceability[11] . This allows the testers to:
- Analyze impact, e.g., change impact analysis
- Evaluate coverage
- Track status
Moreover, this allows the tester(s) to ensure the consistency between the linked elements, textually and semantically.
ASPICE differentiates between vertical and horizontal traceability:
Vertically: ASPICE requires that stakeholder requirements be linked across all levels to the software units. In doing so, the link over all levels of development ensures consistency between the related work products.
Horizontally: ASPICE requires traceability and consistency, between the work results of the development and the corresponding test specifications and test results.
In addition, the base practice SUP.10.BP4 requires bidirectional traceability between change requests and work products affected by the change requests. Because change requests are often initiated by a defect, bidirectional traceability is established between change requests and the corresponding defect reports. Because of the occasionally large number of links, a consistent chain of tools can be helpful. This allows the tester to efficiently create and manage the dependencies.
11 In the following, the term traceability will always imply the bidirectional traceability.
5.2.2 – Applying Review Techniques
A well-defined test basis serves as the cornerstone for ensuring the quality of work products and the success of projects. Reviewing the test basis helps identify and address defects early, preventing defects from escaping to subsequent phases.
The TA can employ various review techniques during the individual review to identify defects in the test basis. Selecting the most appropriate review technique can enhance the efficiency and effectiveness of the review. This selection should consider factors such as reviewing goals, project objectives, available resources, test basis type, associated risks, business domain, and company culture.
Below, this syllabus discusses five review techniques commonly used by the TA.
Ad hoc reviewing is carried out by reviewers informally, without a structured process. Reviewers are provided with little or no guidance on how the task should be performed. Ad hoc reviewing needs little preparation and is highly dependent on the reviewers’ skills. During the review, reviewers read the test basis and document the anomalies as they encounter them. This technique, left unmanaged, can lead to a high volume of duplicate anomaly reports from multiple reviewers.
Checklist-based reviewing involves evaluating the test basis against a predefined checklist. Checklists remind reviewers to check specific points and can de-personalize the review. Checklists can be generic or specific to quality characteristics, test objectives, or test basis type. The TA tailors the checklist to the test basis type, risk level, or test condition. This ensures that the review will focus on the most relevant aspects of the test basis. Checklists should be regularly updated with previously missed defects. Keeping checklists current prevents overlooking newly identified anomalies. Checklists are not all-inclusive. Therefore, the TA is not limited to checking the listed items. This maximizes defect detection and allows the TA to capture anomalies that checklists may not explicitly cover.
Scenario-based reviewing involves simulating a process or activity to identify anomalies and refine the test basis. This review technique is most effective when the test basis has a scenario-based format, such as a use case or activity diagram. In such cases, reviewers can perform "dry runs" based on the expected usage of the work product. Scenarios provide valuable guidelines, but the reviewers are not constrained to documented scenarios and should also think beyond the scenarios to identify more anomalies.
Role-based reviewing involves assigning specific roles or responsibilities to reviewers. Typical roles are based on specific end-user types (e.g., experienced, inexperienced, senior, or child user) or specific roles in the organization (e.g., administrator or regular user). Each role can be described by a persona (i.e., the concrete but fictional character designed to represent the characteristics, needs, goals, and preferences of a particular group of users). By distributing responsibilities among reviewers based on their roles, rolebased reviews allow individuals to focus on specific aspects of the test basis, ensuring comprehensive coverage and, at the same time, avoiding duplication of anomalies.
Perspective-based reading involves reviewing the test basis from various perspectives or viewpoints (e.g., designer, tester, marketer, administrator, and end user). This leads to more in-depth individual reviewing with less duplication of anomalies among reviewers. In addition, perspective-based reading requires the reviewers to attempt to use the test basis under review to generate the work product they would derive from it. For example, a tester would attempt to generate draft acceptance tests based on requirements specifications to see if all the necessary information is included.
5.2 – Supporting Phase Containment
The objective of phase containment is to detect and remove defects in the same phase of the SDLC in which they were introduced. In Agile software development, the shift left approach can be used similarly. This policy reduces the cost of quality. Because the test basis is an important input to test analysis and test design, the TA can best contribute to phase containment by evaluating the test basis quality. Early attention to test basis quality will minimize later effort and prevent the propagation of defects to subsequent phases. This syllabus discusses two common options for the TA to find defects in the test basis: modeling for testing purposes and reviewing the test basis using various review techniques ( ISO/IEC 20246 , 2017).
3.3 – Test Reporting
Test reporting includes various activities, but this section focuses on various coverage metrics to reflect test progress, support decision-making, and enhance transparency. These coverage types should align with team goals, support rapid feedback cycles, and be lightweight enough to be useful without causing unnecessary overhead. Agile teams prefer coverage indicators that foster shared understanding of system quality and risks.
Requirements coverage is common, especially in the context of ATDD or BDD. By linking automated acceptance tests to user stories or examples, teams can demonstrate which functional aspects have been specified, developed, and verified. These acceptance criteria become traceable units of coverage, helping the team communicate user story readiness and completeness.
Code coverage can be used selectively, especially in highly automated test environments. It should be interpreted cautiously and should not be treated as a proxy for quality. While useful for identifying untested logic paths, high code coverage alone does not guarantee meaningful testing. Agile teams may combine this with fault seeding or assertion quality reviews to gain deeper insights into test effectiveness.
Exploratory testing related coverage can be reported using session-based test management or test charter completion rates. This is particularly valuable for business-facing exploratory testing, usability testing, or testing in risk areas that lack formal specifications. Visual dashboards can be used to represent what has been explored and which scenarios or personas have been exercised.
Infrastructure and environment coverage , particularly in DevOps and continuous delivery contexts, may be tracked to show which platforms, configurations, or APIs have been exercised. Monitoring and observability tools also enhance operational coverage reporting by revealing usage patterns and anomalies in production.
In all cases, coverage metrics in Agile should be discussed collaboratively, not just consumed as abstract indicators. They must support informed decision-making and adapt to organizational, project, and team contexts, rather than being imposed as prescriptive metrics. Test metrics are tools for communication and improvement in iterative and adaptive software development lifecycles. Teams should resist the illusion of completeness created by metrics and instead provide tailored information to meet the needs of different stakeholders.
2.2.1 – Test Analysis with Generative AI
GenAI can support test analysis tasks by generating and prioritizing test conditions, identifying defects in the test basis and providing coverage analysis. The input data includes requirements, user stories, technical specifications, GUI wireframes and other relevant information. The output consists of typical test analysis work products, such as prioritized test conditions (e.g., acceptance criteria).
Here are some typical test analysis tasks that can be supported by GenAI:
- Identify potential defects in the test basis : GenAI can help analyze the test basis for inconsistencies, ambiguities, or incomplete information that could lead to defects. By comparing similar requirement patterns or applying knowledge from previous defect reports, the LLM can flag potential anomalies and suggest improvements.
- Generating test conditions based on the test basis, for example on requirements/user stories: LLMs can analyze requirements and user stories to generate test conditions. Using natural language processing, they can interpret the meaning of requirements and break them down into measurable, testable statements. This can help translate requirements into specific test conditions.
- Prioritize test conditions based on risk level: With information on the risk likelihood and risk impact of failure for each test condition, an LLM can help prioritize test effort. By considering aspects such as regulatory compliance, user-facing features (e.g., login functionality or payment processing), and historical defect data, the LLM can recommend priority levels.
- Support coverage analysis: By mapping requirements and user stories to test conditions, an LLM can perform coverage analysis to determine whether all aspects of the test basis are covered. This is particularly useful for projects with complex requirements, where gaps in coverage can lead to escaped defects.
- Suggest test techniques: GenAI can suggest relevant test techniques (e.g., boundary value analysis, equivalence partitioning) based on the type of requirement or user story being tested. This can help testers apply the most effective test techniques for specific test conditions.
The quality and relevance of inputs provided to the LLM in relation to the task to be completed directly impact the accuracy and precision of the output generated by the LLM.
Hands-On Objective 2.2.1a (H2): Practice creating structured multimodal prompts to generate acceptance criteria for a user story based on a GUI wireframe
This is an exercise to practice writing structured prompts using multimodal input (text and image). The goal is to generate high quality (i.e. well-formed, clear and complete) acceptance criteria from a user story and a GUI wireframe. Other text elements can be added to provide context, such as constraints on input fields or business rules to be applied to data processing.
The results obtained from the LLM are compared to assess the impact of different formulations of the structured prompt (role, context, instruction, textual and image input data, constraints, and output format) for a test analysis task.
This exercise provides practical experience in the importance of prompt structuring, the contribution of precise instructions, and the importance of both textual and image contextual data in obtaining accurate and relevant results from the LLM.
Hands-On Objective 2.2.1b (H2): Practice prompt chaining and human verification to progressively analyze a given user story and refine acceptance criteria
This is an exercise to practice prompt chaining to analyze a given user story and refine acceptance criteria, first by identifying ambiguities, then by evaluating testability, and finally by evaluating completeness. This exercise encourages a step-by-step approach, refining the analysis at each step to ensure that the acceptance criteria are well-formed and actionable to achieve the test objectives. At each step, the results provided by the LLM are manually verified and corrected, if necessary, either by adjusting the output or through a prompt chaining process with the LLM. In this way, the next stage uses a clean result from the previous stage to address another aspect of improving the acceptance criteria.
This exercise provides practical experience of the benefits of breaking down a complex task into subtasks, with human verification of the results of each stage.
4.4 – Analyzing Results and Reporting
Section 4.1.2 discussed the various metrics in a performance test plan. Defining these up front determines what must be measured for each test run. After completion of a test cycle, data should be collected for the defined metrics.
When analyzing the data it is first compared to the performance test objective. Once the behavior is understood, conclusions can be drawn which provide a meaningful summary report that includes recommended actions. These actions may include changing physical components (e.g., hardware, routers), changing software (e.g., optimizing applications and database calls), and altering the network (e.g., load balancing, routing).
The following data is typically analyzed:
- Status of simulated (e.g., virtual) users . This needs to be examined first. It is normally expected that all simulated users have been able to accomplish the tasks specified in the operational profile. Any interruption to this activity would mimic what an actual user may experience. This makes it very important to first see that all user activity is completed since any errors encountered may influence the other performance data.
- Transaction response time . This can be measured in multiple ways, including minimum, maximum, average, and a percentile (e.g., 90[th] ). The minimum and maximum readings show the extremes of the system performance. The average performance is not necessarily indicative of anything other than the mathematical average and can often be skewed by outliers. The 90th percentile is often used as a goal since it represents the majority of users attaining a specific performance threshold. It is not recommended to require 100% compliance with the performance objectives as the resources required may be too large and the net effect to the users will often be minor.
- Transactions per second . This provides information on how much work was done by the system (system throughput).
- Transaction failures . This data is used when analyzing transactions per second. Failures indicate the expected event or process did not complete, or did not execute. Any failures encountered are a cause for concern and the root cause must be investigated. Failed transactions may also result in invalid transactions per second data since a failed transaction will take far less time than a completed one.
- Hits (or requests) per second . This provides a sense of the number of hits to a server by the simulated users during each second of the test.
- Network throughput. This is usually measured in bits by time interval, as in bits per second. This represents the amount of data the simulated users receive from the server every second. (see Section 4.2.5)
- HTTP responses. These are measured per second and include possible response codes such as: 200, 302, 304, 404, the latter indicating that a page is not found.
Although much of this information can be presented in tables, graphical representations make it easier to view the data and identify trends.
Techniques used in analyzing data can include:
- Comparing results to stated requirements
- Observing trends in results
- Statistical quality control techniques
- Identifying errors
- Comparing expected and actual results
- Comparing the results to prior test results
- Verifying proper functioning of components (e.g., servers, networks)
Identifying correlation between metrics can help us understand at what point system performance begins to degrade. For example, what number of transactions per second were processed when the CPU reached 90% capacity and the system slowed?
Analysis can help identify the root cause of the performance degradation or failure, which in turn will facilitate correction. Confirmation testing will help determine if the corrective action addressed the root cause.
Reporting
Analysis results are consolidated and compared against the objectives stated in the performance test plan. These may be reported in the overall test status report together with other test results, or included in a dedicated report for performance testing. The level of detail reported should match the needs of the stakeholders. The recommendations based on these results typically address software release criteria (including target environment) or required performance improvements.
A typical performance testing report may include:
Executive Summary
This section is completed once all performance testing has been done and all results have been analyzed and understood. The goal is to present concise and understandable conclusions, findings, and recommendations for management with the goal of an actionable outcome.
Test Results
Test results may include some or all of the following information:
- A summary providing an explanation and elaboration of the results.
- Results of a baseline test that serves as “snapshot” of system performance at a given time and forms the basis of comparison with subsequent tests. The results should include the date/time the test started, the concurrent user goal, the throughput measured, and key findings. Key findings may include overall error rate measured, response time and average throughput.
- A high-level diagram showing any architectural components that could (or did) impact test objectives.
- A detailed analysis (tables and charts) of the test results showing response times, transaction rates, error rates and performance analysis. The analysis also includes a description of what was observed, such as at what point a stable application became unstable and the source of failures (e.g., web server, database server).
Test Logs/Information Recorded
A log of each test run should be recorded. The log typically includes the following:
- Date/time of test start
- Test duration
- Scripts used for test (including script mix if multiple scripts are used) and relevant script configuration data
- Test data file(s) used by the test
- Name and location of data/log files created during test
- HW/SW configuration tested (especially any changes between runs)
- Average and peak CPU and RAM utilization on web and database servers
- Notes on achieved performance
- Defects identified
Recommendations
Recommendations resulting from the tests may include the following:
- Technical changes recommended, such as reconfiguring hardware or software or network infrastructure
- Areas identified for further analysis (e.g., analysis of web server logs to help identify root causes of issues and/or errors)
- Additional monitoring required of gateways, servers, and networks so that more detailed data can be obtained for measuring performance characteristics and trends (e.g., degradation)
4.4.1 – Error Guessing
Error guessing is a test technique used to anticipate the occurrence of errors, defects, and failures, based on the tester’s knowledge, including:
- How the application has worked in the past
- The types of errors the developers tend to make and the types of defects that result from these errors
- The types of failures that have occurred in other, similar applications
In general, errors, defects and failures may be related to: input (e.g., correct input not accepted, parameters wrong or missing), output (e.g., wrong format, wrong result), logic (e.g., missing cases, wrong operator), computation (e.g., incorrect operand, wrong computation), interfaces (e.g., parameter mismatch, incompatible types), or data (e.g., incorrect initialization, wrong type).
Fault attacks are a way to implement error guessing. This test technique requires the tester to create or acquire a list of possible errors, defects and failures, and to design tests that will identify defects associated with the errors, expose the defects, or cause the failures. These lists can be built based on experience, defect and failure data, or from common knowledge about why software fails.
See (Whittaker 2002, Whittaker 2003, Andrews 2006) for more information on error guessing and fault attacks.
5.6.4 – Usability Test Report
A usability test report is a document that communicates the findings from a usability test. A usability test report is mandatory for a usability test and is generally written by the usability tester or the moderator.
The purpose of the usability test report is to document and communicate the most important findings from a usability test. The report must be effective and efficient for the key stakeholders, in particular the development team and managers who make decisions about what will be changed.
A usability test report contains the following sections [Barnum12]:
| Chapter | Title | Description of Contents |
|---|---|---|
|
1 |
Executive Summary |
A short executive summary containing descriptions of the object of the evaluation, techniques(s) used, most important findings and general recommendations based on the findings |
|
2 |
Table of contents |
|
|
3 |
Findings and recommendations |
See section 5.6.1 |
|
4 |
Objectives |
Description of the objective of evaluation |
|
5 |
Purpose |
Purpose of the evaluation, including listings of or references to relevant usability requirements |
| 6 | Evaluation method |
|
| 7 | Contacts | Name and contact details of the moderator(s) and note-taker(s) involved in the usability test |
[Web-9] provides a free sample usability test report.
2.2.3 – Automated Regression Testing with Generative AI
As each new iteration or release is completed, the number of regression test cases to be run often increases, making them ideal candidates for automation, particularly in Continuous Integration / Continuous Delivery (CI/CD) pipelines due to the high frequency of test execution. GenAI can streamline this process by assisting in the creation, maintenance, and optimization of automated regression test suites. By dynamically adapting to codebase changes and performing impact analysis, GenAI can identify which areas of the software are most likely to be affected by recent modifications, focusing regression test efforts where they are most needed.
Here are some typical automated regression testing and test reporting activities that can be supported by GenAI prompting:
- Automated test script implementation with keyword-driven automation : LLMs can be used to implement test scripts based on keyword-driven test automation frameworks, where predefined keywords represent common test steps. GenAI can map these keywords to specific test cases, generate test scripts and assist testers and test automation engineers in their work.
- Impact analysis and test optimization : GenAI can be used to analyze code changes in order to identify high-risk areas, thereby enabling targeted regression testing where it is most needed.
- Self-healing and adaptive tests : GenAI can be used to automatically adjust test scripts to handle minor UI or API changes, preventing unnecessary failures from small modifications and ensuring that test suites remain stable over time.
- Automated test reporting and insights : GenAI enables the generation of detailed, timely available test reports with success metrics, failures, and key insights, providing stakeholders with dashboards that highlight testing trends and offer predictive insights on potential failure points.
- Enhanced defect reporting and root cause analysi s: GenAI can facilitate the automatic compilation of comprehensive defect reports with test logs, screenshots, and test environment data.
These activities can be applied to a variety of regression tests, including functional and non-functional regression tests. However, the testers must be aware that GenAI can make mistakes. The generated output must therefore be carefully checked, depending on the associated risk (see chapter 3).
Furthermore, GenAI can assist end-to-end GUI and API-based automated regression tests, each with its distinctive challenges and solutions. GUI tests frequently become unstable due to recurrent changes to the user interface. GenAI can automatically adapt test scripts to handle changes like dynamic locators and modified interactions, reducing the need for manual intervention. API regression tests face challenges such as changing request/response formats, endpoints, and authentication. GenAI can adapt test scripts automatically to evolving API specifications and generate diverse test data, maintaining comprehensive coverage and reducing the need for manual updates.
Hands-On Objective 2.2.3a (H2): Practice few-shot prompting to create and manage keyworddriven test scripts
This exercise focuses on developing and automating test scripts for a given web application using a GUI test automation framework. The exercise is structured into two main sections: test automation and test script debugging. The first part of the exercise provides guidance on creating documentation for a keyword library, generating initial test scripts, having AI validate these test scripts, and expanding the coverage with additional test scripts. The second part places an emphasis on debugging support, using system prompts to create an AI assistant that can check and correct test scripts.
This exercise combines traditional test automation with AI-assisted validation, demonstrating how fewshot prompting can be effectively used to create, maintain, and debug keyword-driven test scripts.
Hands-On Objective 2.2.3b (H2): Practice writing structured prompts for test report analysis in the context of regression testing
This exercise illustrates a methodical approach to analyzing regression test reports, utilizing structured prompts. The process begins with an analysis of the provided test results and a comparison with the test specification. It then progresses to the clustering of similar defects, the maintenance of a known anomalies list, and a cross-checking of findings. Each step is linked to the next one in a single LLM conversation.
The step-by-step approach demonstrates how structured prompts can be used to transform regression test results and test logs into actionable insights, thereby supporting effective test report analysis in the context of regression testing.
1.1.2 – Testing and Debugging
Testing and debugging are separate activities. Testing can trigger failures that are caused by defects in the software (dynamic testing) or can directly find defects in the test object (static testing).
When dynamic testing (see chapter 4) triggers a failure, debugging is concerned with finding causes of this failure (defects), analyzing these causes, and eliminating them. The typical debugging process in this case involves:
- Reproduction of a failure
- Diagnosis (finding the defect)
- Fixing the defect
Subsequent confirmation testing checks whether the fixes resolved the problem. Preferably, confirmation testing is done by the same person who performed the initial test. Subsequent regression testing can also be performed, to check whether the fixes are causing failures in other parts of the test object (see section 2.2.3 for more information on confirmation testing and regression testing).
When static testing identifies a defect, debugging is concerned with removing it. There is no need for reproduction or diagnosis, since static testing directly finds defects, and cannot cause failures (see chapter 3).
5.6.5 – Best Practices in Usability Test Reporting
The single most important practice in all forms of usability evaluation is to ensure that all those involved communicate in a positive and productive manner with the development team and the
stakeholders. Many of the aspects discussed in section 5.6.3 about selling usability findings apply to reporting.The following table summarizes best practices in usability test reporting:
| Best Practice Name | Best Practice Description |
|---|---|
|
Involve and respect stakeholders |
|
|
Make the main report short and comprehensible |
|
|
Include a usable Executive summary |
|
|
Keep to the point |
|
|
Rate the severity of all findings |
|
|
Include positive findings |
|
|
Ensure completeness |
|
|
Respect private or sensitive information |
|
The best practices described above are exemplified in a free, sample usability test report. [Web-9]
Note that in agile software development, the above-mentioned best practices may not have the same level of importance:
- There is less emphasis placed on documentation. Usability findings may not be formally documented and the usability test report may take the form of a verbal briefing. A written usability test report is not excluded, but the best practices mentioned above concerning briefness and keeping to the point will be given a high level of importance.
- Agile teams may turn test results directly into backlog items or bug reports.
- Usability results and findings are discussed within the entire team and corrective measures agreed. This often takes place without formal documentation on a daily basis or in a retrospective meeting at the end of an iteration.
7.2 – Types of Localization Defects and their Causes
1.2.2 – Risk Assessment
While risk identification is about identifying as many pertinent risks as possible, risk assessment is the study of those identified risks to categorize each risk and determine the likelihood and impact associated with it.
The likelihood of a product risk is usually interpreted as the probability of the occurrence of the failure in the system under test. The Technical Test Analyst contributes to understanding the probability of each technical product risk whereas the Test Analyst contributes to understanding the potential business impact of the problem should it occur.
Project risks that become issues can impact the overall success of the project. Typically, the following generic project risk factors need to be considered:
- Conflict between stakeholders regarding technical requirements
- Communication problems resulting from the geographical distribution of the development organization
- Tools and technology (including relevant skills)
- Time, resource, and management pressure
- Lack of earlier quality assurance
- High change rates of technical requirements
Product risks that become issues may result in higher numbers of defects. Typically, the following generic product risk factors need to be considered:
- Complexity of technology
- Code complexity
- Amount of change in the source code (insertions, deletions, modifications)
- Large number of defects found relating to technical quality characteristics (defect history)
- Technical interface and integration issues
Given the available risk information, the Technical Test Analyst proposes an initial risk likelihood according to the guidelines established by the Test Manager. The initial value may be modified by the Test Manager when all stakeholder views have been considered. The risk impact is normally determined by the Test Analyst.